Measures Insight
eG agents are capable of extracting a wealth of performance information pertaining to the managed components. Larger the environment, larger will be the number of measures collected. The biggest challenge for the administrators of such large environments therefore, is to isolate and attend to the anomalies surrounding certain critical performance metrics. For instance, administrators of large, mission-critial Citrix environments might want to focus on some sensitive performance areas such as user sessions to the Citrix farm, resource usage by applications published on the farm, the rate of growth of the user profiles, etc. The metrics related to these areas are mapped to different layers and different tests of the Citrix monitoring model. Instead of taking the longer layer-test-measure route, administrators might prefer a single interface that provides a consolidated list of metrics collected from across the Citrix environment, so that they can easily pick and choose the metrics of interest to them. The MEASURES page (see Figure 1) that appears upon clicking the Measures menu option provides this much-needed measure focus.

To view the metrics related to a specific component, select a component from the Component list in Figure 1. If there are too many components in the list to choose from, you can specify the whole/part of the component name/type to search for in this list. The Component list will then be populated with all component names and/or component types that embed the specified search string (see Figure 2). Select the component of your choice from this list. To view all measures pertaining to the chosen component, just click on the Submit button.
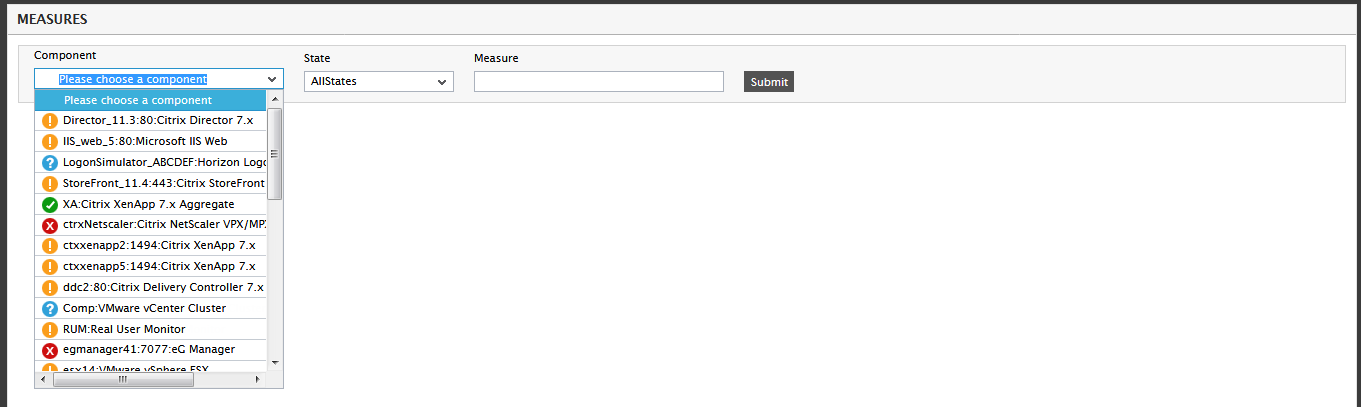
Figure 2 : Filtering component-types
Figure 3 then appears, displaying all the measurements pertaining to that component.
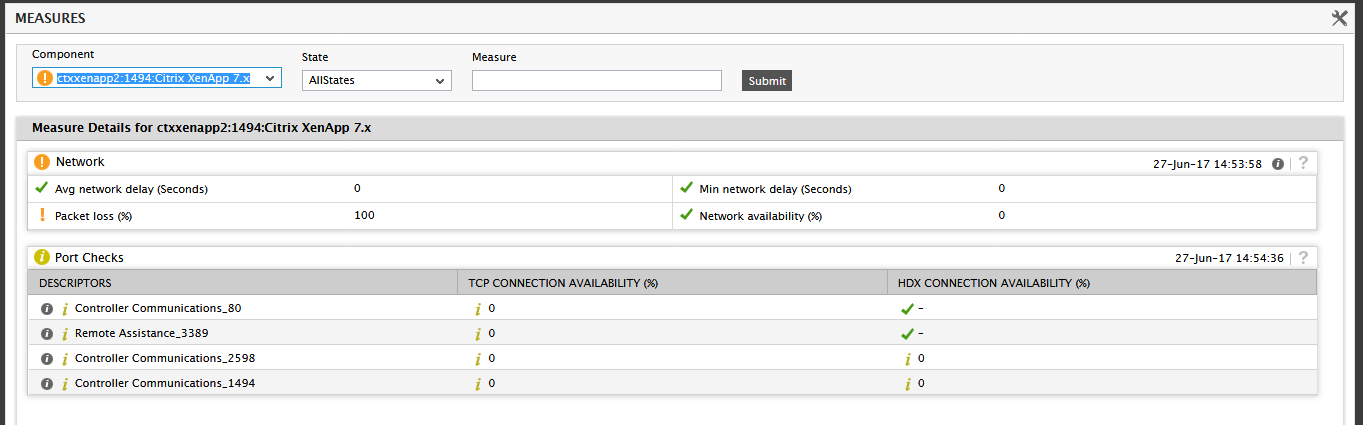
Figure 3 : Viewing the measurements reported for a chosen component
If you want to know which metrics are in a particular state currently, select a state from the State list and click the Submit button (see Figure 4).
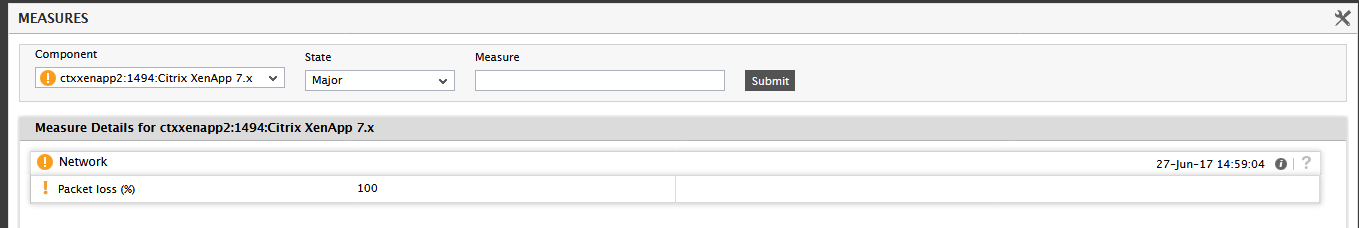
Figure 4 : Measures of a particular state
You can also search for a measure by its name, by specifying the whole/part of the measure name in the Measure text box. Then, click on the Submit button. All the measures that embed the specified search string will then appear (see Figure 5).
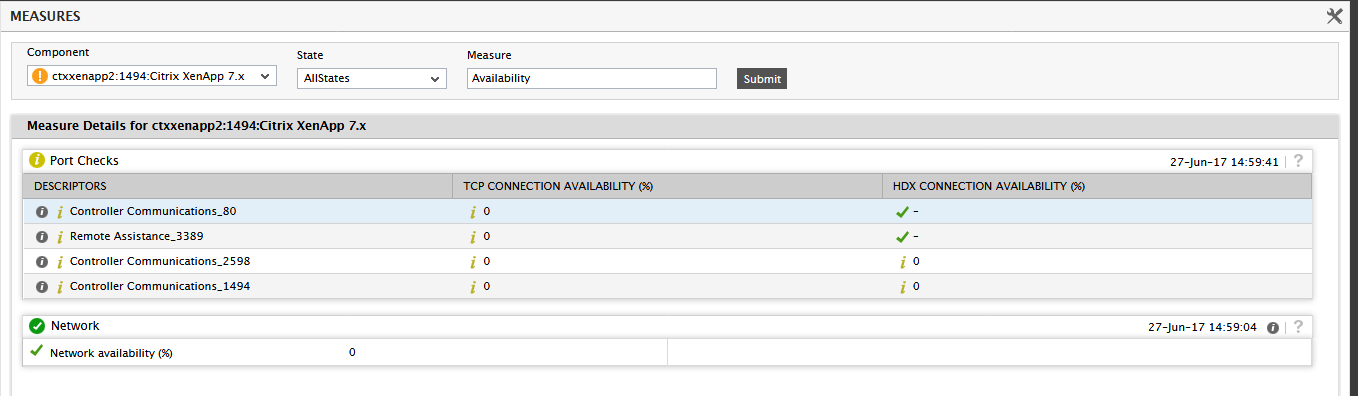
Figure 5 : Viewing the measures that embed a specified Measure string
Alternatively, you can choose the measure of interest from the complete list of measures associated with a selected component. To view this measure list, first, select a Component and then, click on the  icon in the right top corner of the page. Doing so invokes a LIST OF MEASURES pop up window (see Figure 6) with a Measures section that provides hyperlinks to all the measures that the eG agent has extracted from the selected component. Clicking on a measure link here will auto populate the measure in the Measure text box and indicate the current state of the measure and the last value reported for that measure (see Figure 6).
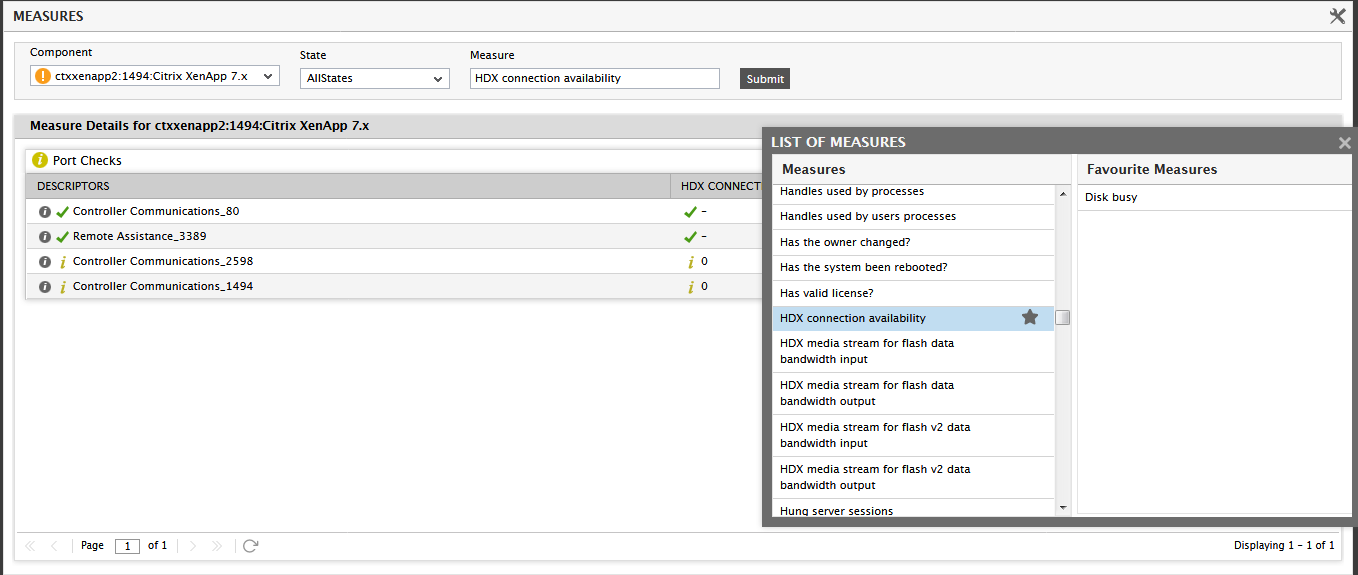
Figure 6 : Clicking on a measure link to view the state of a measure
You can click on the measure value to view the detailed diagnosis / graph (whichever is available) of the corresponding measure during the last 1 hour. You can even ensure that the detailed diagnosis / graph appears in a new window by first selecting the check box before the symbol, and then clicking on the measure value.
To be able to quickly access key measures, you can save the frequently accessed or critical measures as favorites. To achieve this, click on the measure in the Measures section of the LIST OF MEASURES pop up window, and then, click on the  button (see Figure 7). The chosen measure will automatically get added to the Favourite Measures section.
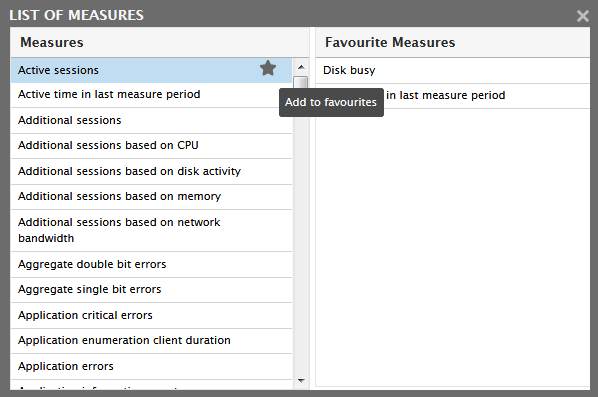
Figure 7 : Adding a measure to List of Favorites
You can delete a 'favorite', by simply clicking the 'X' button next to the measure in the Favourite Measures section (see Figure 8).
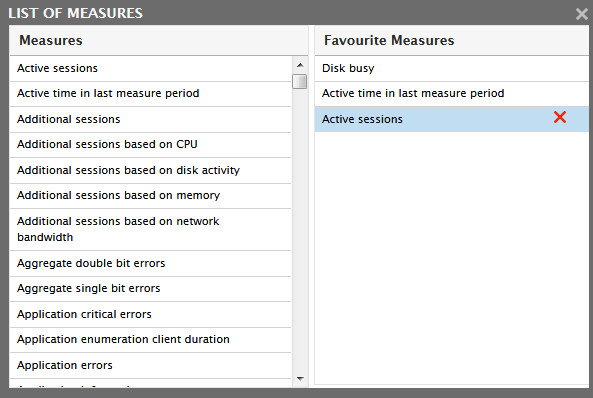
Figure 8 : Deleting a measures from the Favourite Measures section