Miscellaneous
User View
While managing a large number of users to the eG Enterprise system, administrators often find it very difficult to ascertain the overall health of a user's infrastructure, and whether there are any critical unresolved issues in the user environment. eG Enterprise provides a USER VIEW page that displays the number of segments/services/service groups/zones/components associated with a chosen user, and the alarms associated with these infrastructure elements. To access this page, follow the menu sequence: Miscellaneous -> User View.
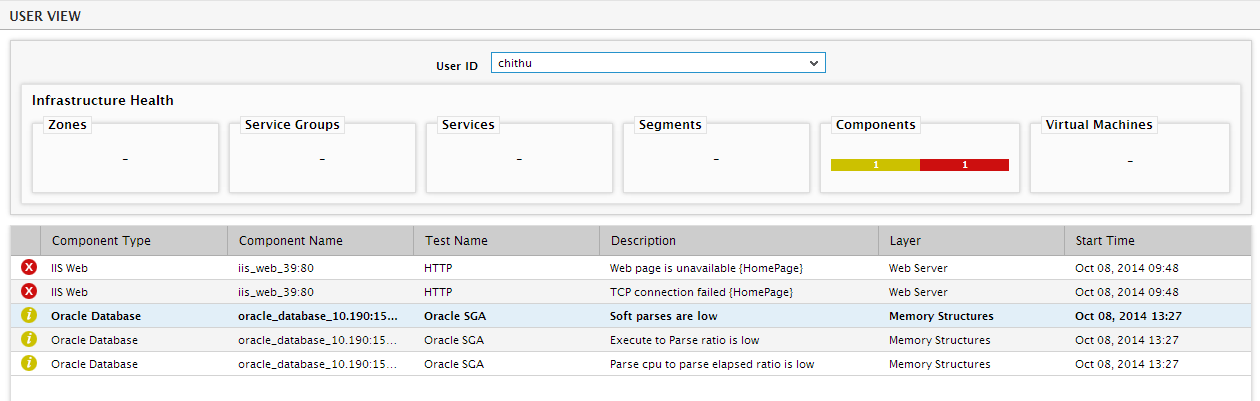
Figure 1 : A selected user’s view of the monitored infrastructure
Select a user from the User Id list and click the Submit button to view the associations of the selected user. Upon clicking the Submit button, an Infrastructure health section will appear that provides an overview of the selected user's environment.
This section displays bar graphs that indicate the number of zones/segments/services/service groups/components associated with the chosen user, and the current state of these elements. Clicking on a division in any of the bars listed in this section will lead the administrator to the corresponding list page. For instance, if you click on the Critical (i.e., RED) division in the Zones bar, then the ZONE LIST page will appear listing only those zones associated with the chosen user that are currently in a CRITICAL state.
Below the Infrastructure health section you will find the Events section that lists the current alarms pertaining to the components associated with the new user. This provides the administrator with an idea of the number and type of open issues in the user environment. Clicking on an alarm leads you to the layer model, tests, and measurements of the problem component.
Note:
The User View option is available only for users with the Admin or Supermonitor rights.