Monitoring Components
To view the status of the components managed by all the eG managers that are reporting to the eG SuperManager, select the Components option from the Hosts/Applications menu in the eG monitor interfaceof the eG SuperManager. By default, the page that appears lists the key performance metrics of a component that is managed in your infrastructure.
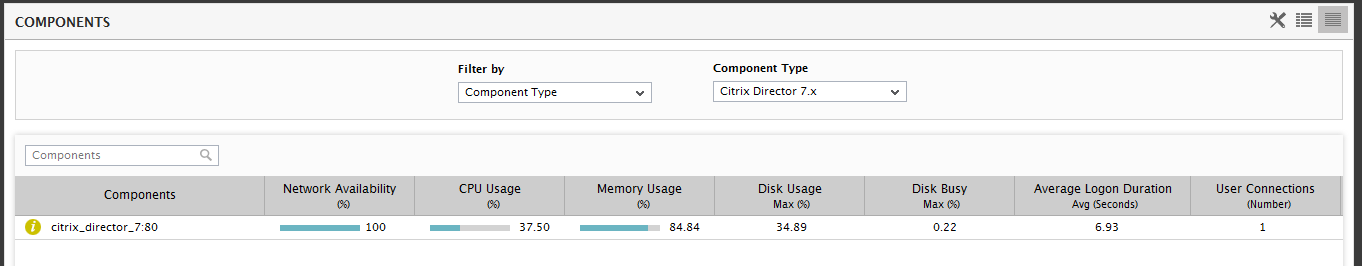
Figure 1 : The COMPONENTS page displaying the key performance metrics
By default, the Component Type option is chosen from the Filter by list. If the zones/services/segments are created by the user who is accessing the eG monitor interface, then the components that are part of the zone/segment/service can be filtered using this list. The Component Type list box by default, lists all the components managed in the target infrastructure. When the COMPONENTS page is accessed for the very first time, the key performance metrics of the component type that comes first in the alphabetical order will be displayed against each component. In Figure 1, the Citrix Director 7.x is the first component in alphabetical order displayed in the Component Type list box.
Alternately, if you wish to view a list of all the components managed in your infrastructure, you can do so by clicking the  icon in Figure 1. By default, the page that appears displays all the managed components in the environment, regardless of whether or not they are part of a segment, service or zone. Accordingly, the Show All Components check box is selected, as depicted by Figure 2. To view only the independent components, deselect the Show All Components check box (see Figure 2).
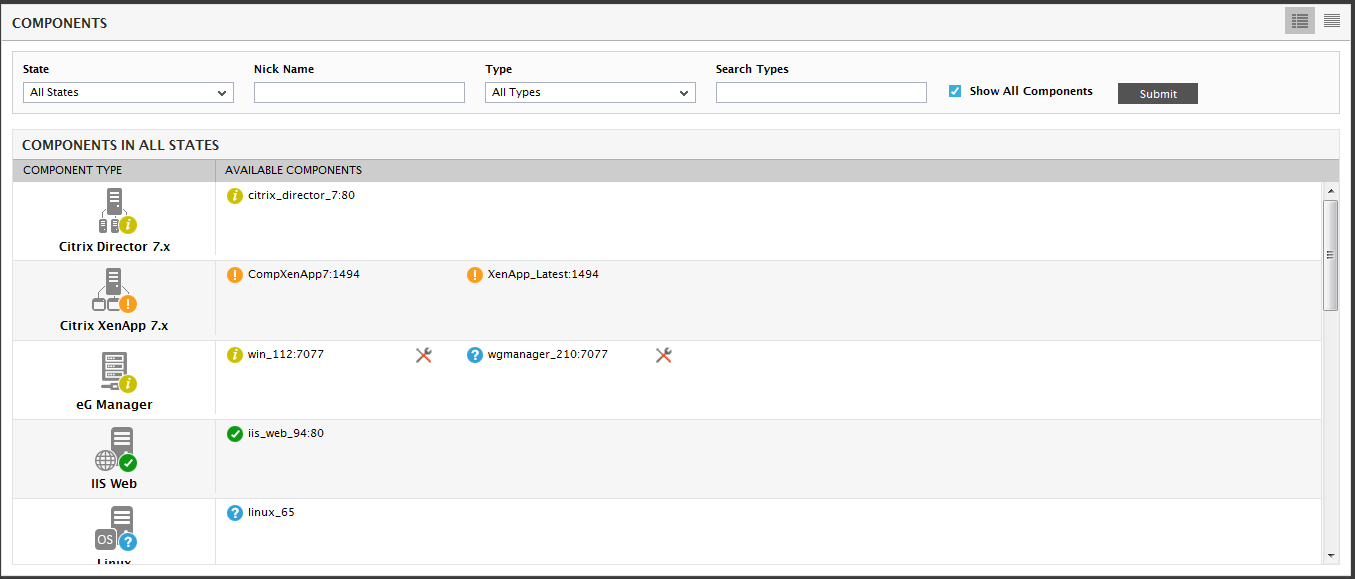
Figure 2 : All managed components available in the infrastructure
The color-coding associated with a component indicates its state: Red indicates critical problems, Green is used to indicate good health, while Blue is used to indicate an unknown state. Also, orange indicates major problems, and amber indicates minor ones.
If one/more maintenance policies are associated with a component, then, during the configured maintenance period, the component list page will display a  icon adjacent to that component. This way, eG Enterprise pictorially conveys to administrators that all alerts pertaining to a component will be suppressed as long as the icon appears alongside that component name.
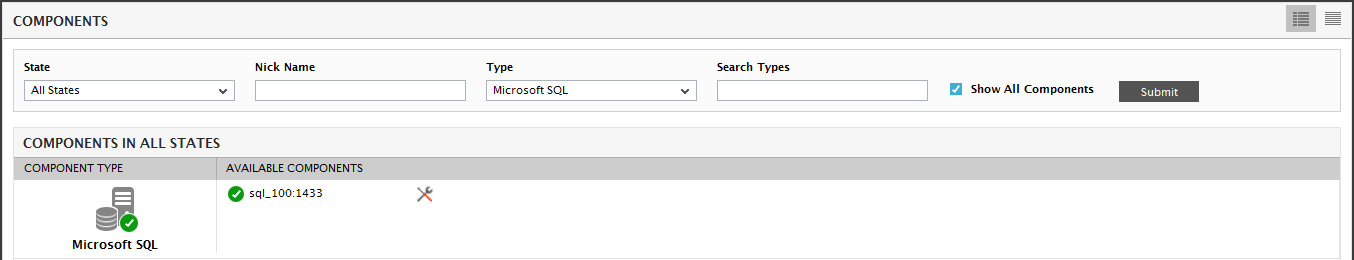
Figure 3 : A component under maintenance
The components that are monitored and viewed in the eG monitor interface of the eG SuperManager is similar to that of the eG monitor interface of the eG Manager.