Monitoring Network Devices
If network devices have been configured for monitoring in your environment, then click on the  icon available in the Monitor tab. Then, select the Network Devices option in the Hosts/Applications tile to view the current state of the Network devices managed by the eG Enterprise system (see Figure 7).
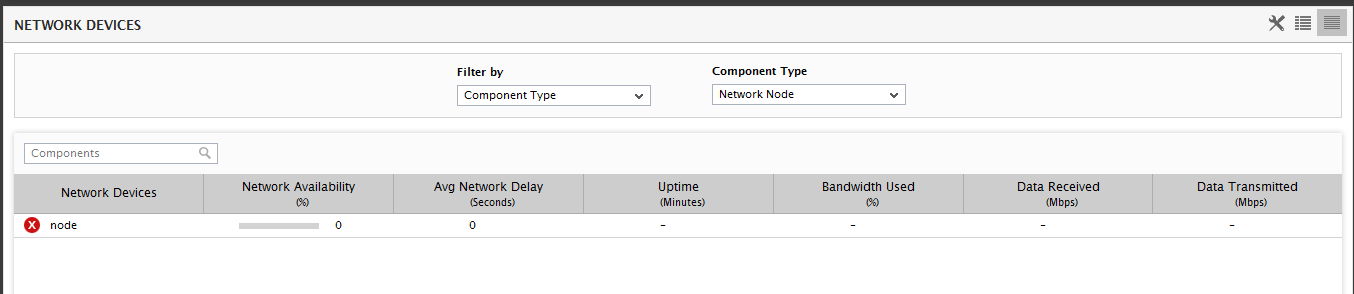
Figure 7 : The Network Devices managed in your infrastructure
By default, eG Enterprise decides certain metrics to be the key performance metrics and displays the same in the NETWORK DEVICES page. If you wish to define the metrics of your choice as the key performance metrics for each network device, then you can do so using the  icon in Figure 7.
To view the list of all the network devices managed in your infrastructure click on the  icon. Figure 8 will then appear listing all the managed network devices.
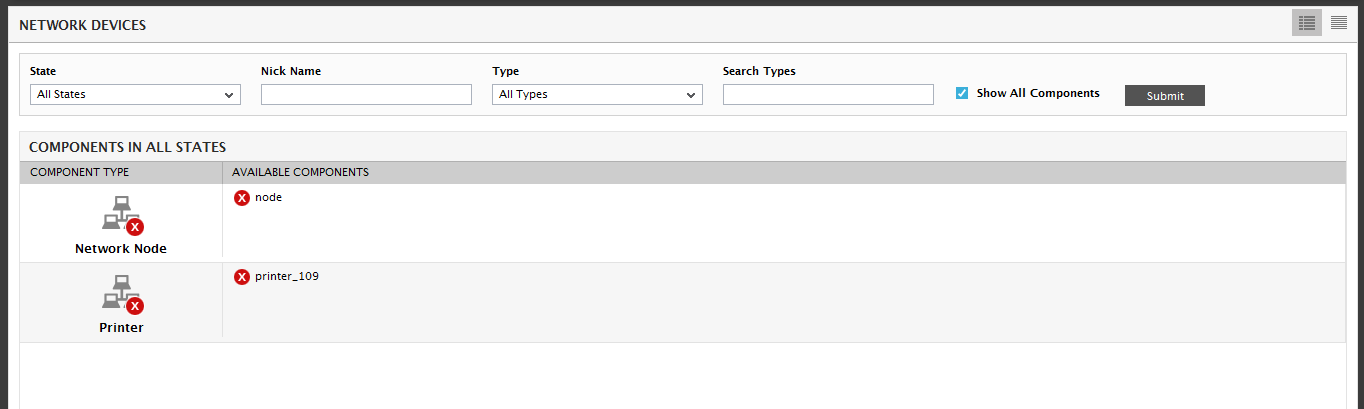
Figure 8 : Listing all the Network devices monitored in the target environment
Clicking on a component in Figure 8 will lead you to Figure 9, where you can view the layer model, tests, and measurements of the chosen network device.
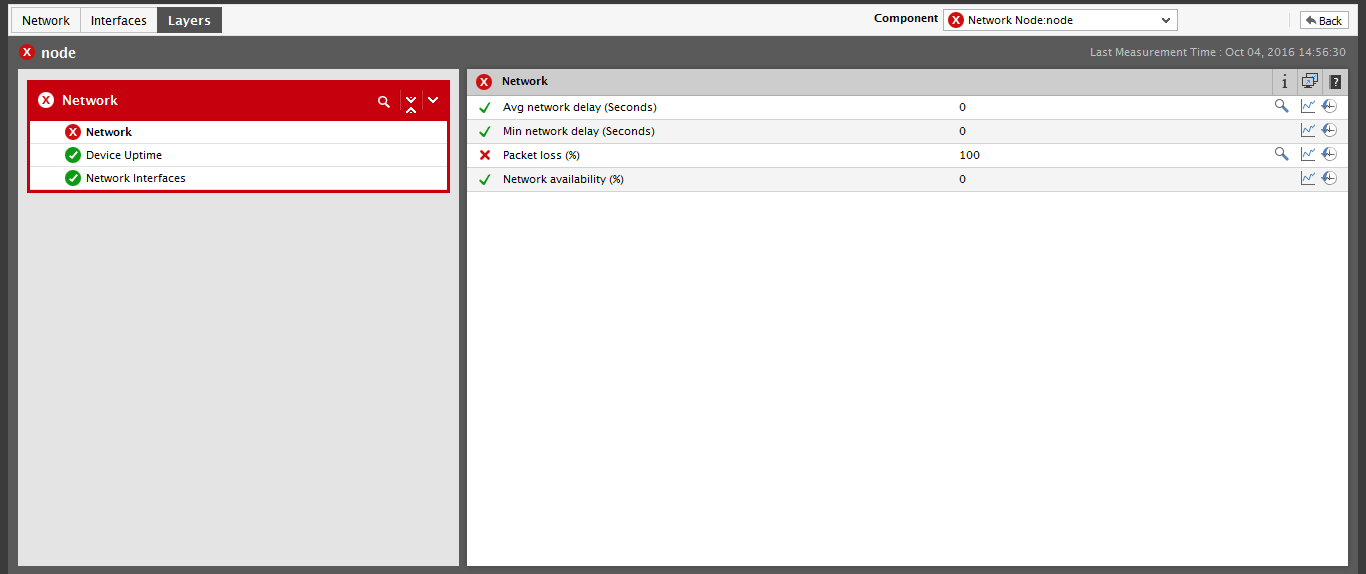
Figure 9 : The layer model that appears when a network device is clicked