Monitoring Segments
eG Enterprise can also be used to monitor components that are not associated with services. For monitoring components that are a part of the component topology configured, choose the Segments option shown in Figure 1.
This will result in the display of the different segments configured for the target infrastructure, and their respective states (see Figure 1). Each segment will be accompanied by the IP/hostname and state of the segment components associated with that segment.
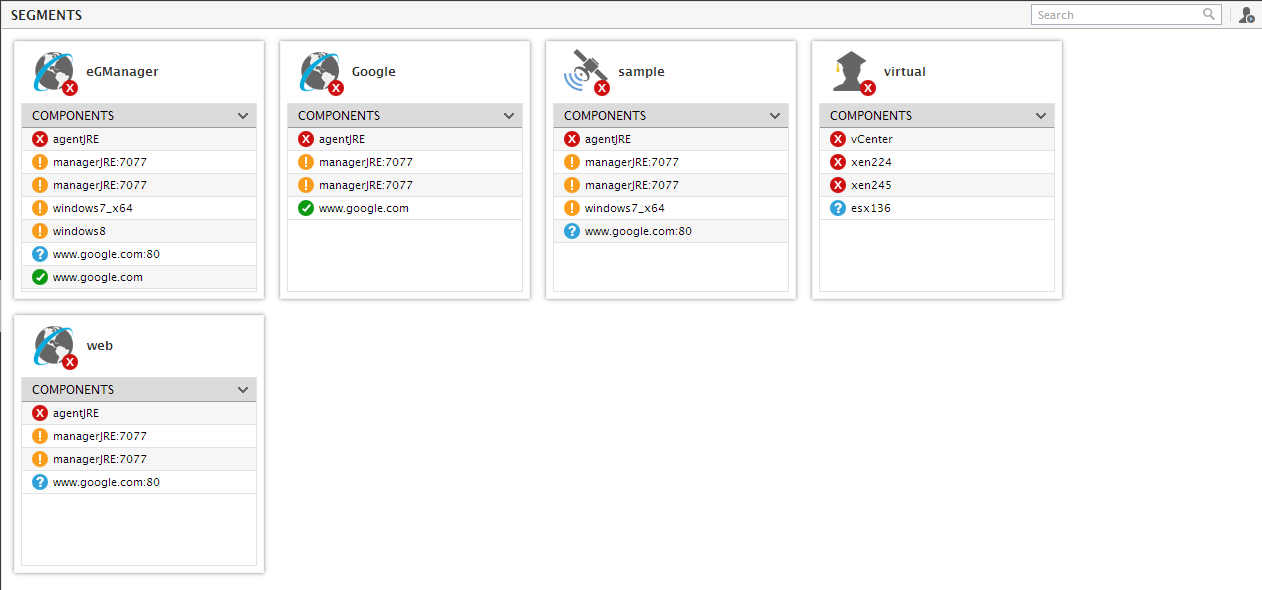
Figure 1 : Segments configured for the environment
Note:
If you want all the component-types associated with a problem segment to be displayed (in Figure 1 ) instead of the component names, then you will have to set the Display component types in segment/service list flag in the monitor settings page (Click on the  icon available in the Admin tab, select the Monitor option from the Settings tile) in the eG administrative interface to Yes. By default, this is set to No.
Note:
By default, against each segment displayed in the segment list page, the top-10 Components included in that segment will be displayed. Typically, to identify the top-10 components, eG Enterprise automatically sorts all the components associated with a segment on the basis of their current state, arranges the sorted list in the alphabetical order of the component names, and picks the first 10 components of this list.
If you want more number of components to be displayed against each segment, do the following:
- Login to the eG administrative interface.
- Click on the icon available in the Admin tab, select the Monitor option from the Settings tile.
- Click the Other Settings sub-node under the General node in the tree-structure in the monitor settings page.
- In the right panel, modify the default value 10 that is displayed in the Components count in segment/service/zone list text box.
- Click the Update button to save the changes.
If a large number of segments are displayed, you can search for a particular segment, by specifying the whole/part of the segment name in the Search text box, and clicking the right-arrow button adjacent to the text box. Doing so will reveal all segments with names that embed the specified search string.
Click on the Associations (  ) button in Figure 2 to view the state of all the fully configured segments in their environment, and the users to which each of them are assigned.
Figure 2 also reveals an 'arrow' button to its left. Clicking on this 'arrow' opens a left panel that consists of a tree-structure (see Figure 2). Each fully-configured segment will appear as the 'nodes' of this tree - besides the segment name, these 'nodes' will also indicate the current state of the segment.
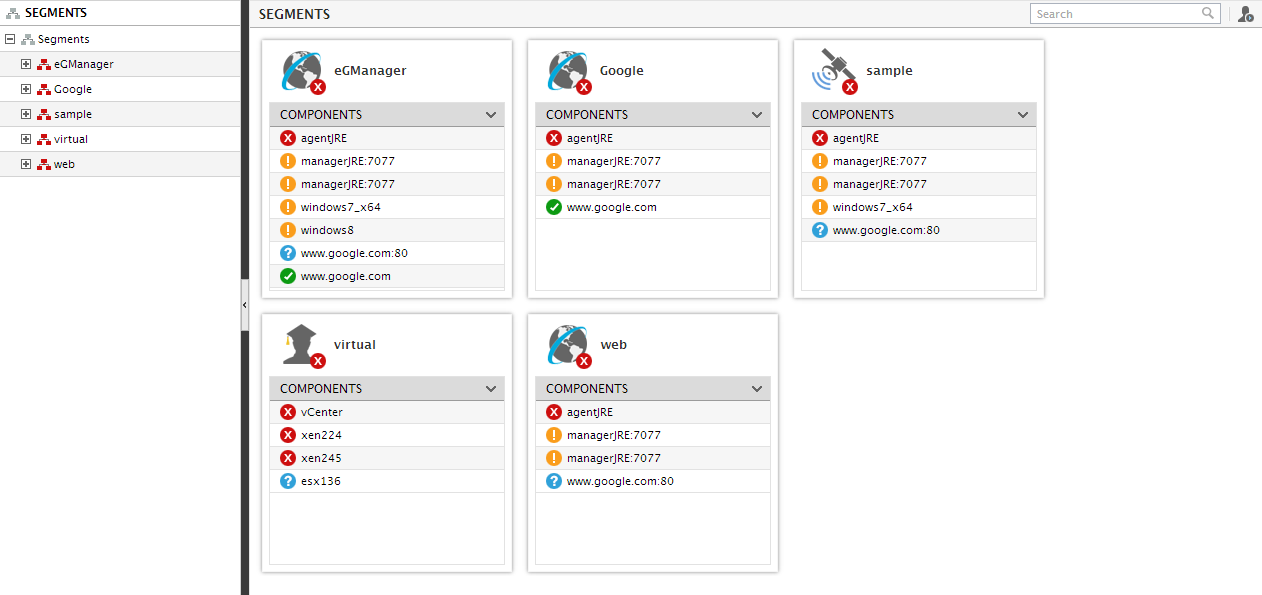
Figure 2 : Segment Dashboard revealing a tree-structure in its left panel
To view the components that form part of a segment and the state of each of these components, expand the 'node' representing the segment of interest to you. The segment components, along with their current status indicators, will then be listed as the sub-nodes of the 'segment node' as depicted by Figure 2. If you click on a 'segment node' in the tree, the right-panel will instantly change to display three tab pages, namely - Segments, Components, and Topology. By default, the Segments tab page will open as soon as a 'segment node' in the tree is clicked (see Figure 2).