Monitoring Service Groups
Once you are in the eG monitoring interface, you will find that the Infrastructure Health section of the eG monitoring console displays the number of configured service groups and the current state of these groups. Clicking on the Service Group label here will lead you to Figure 1, which lists all the configured service groups and their current state. Against every service group, the services included in that group and the current state of each of the services will be available so that, you can instantly identify the services that are in responsible for the abnormal state of the service group. Clicking on a service here will allow you to preview the topology of that service, using which you can identify the root-cause of the problems associated with that service.
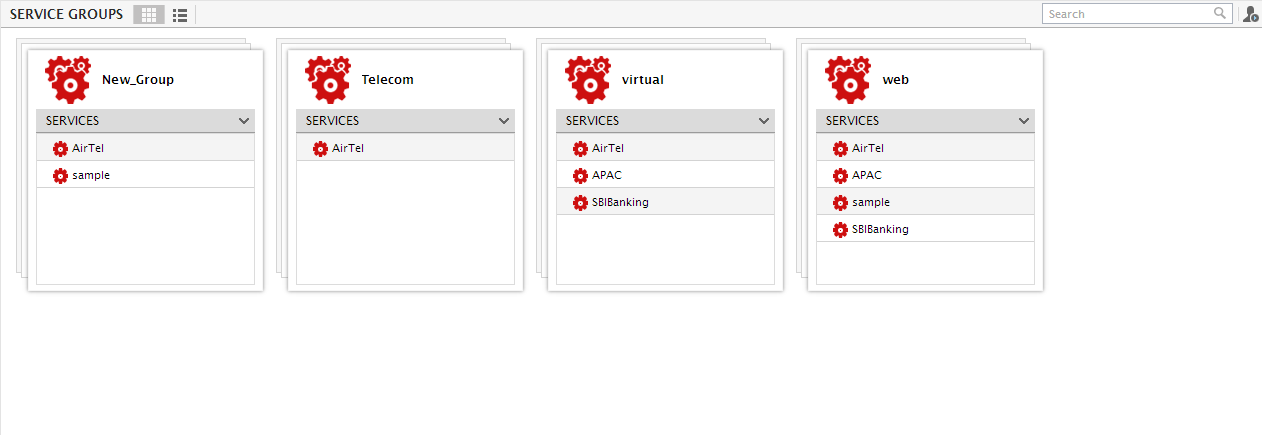
Figure 1 : List of configured service groups and their current state