Monitoring System Components
While eG Enterprise focuses primarily on monitoring applications, many administrators still prefer to view their infrastructure from a hardware perspective - i.e., as systems they support. The eG monitoring console now provides a “system view”, which represents the overall health of systems in the target infrastructure, with a mapping of the applications that are executing on these systems.
To access the systems page that provides the ‘system view’, click on the  icon available in the Monitor tab. Then, select the Systems option from the Hosts/Applications tile.
The SYSTEMS page that appears, indicates the current state of those systems/hosts that have been assigned to the current user for monitoring along with the key performance metrics of each system/host. In case of a 'supermonitor' however, the status of all managed systems in the environment will be available in this page.
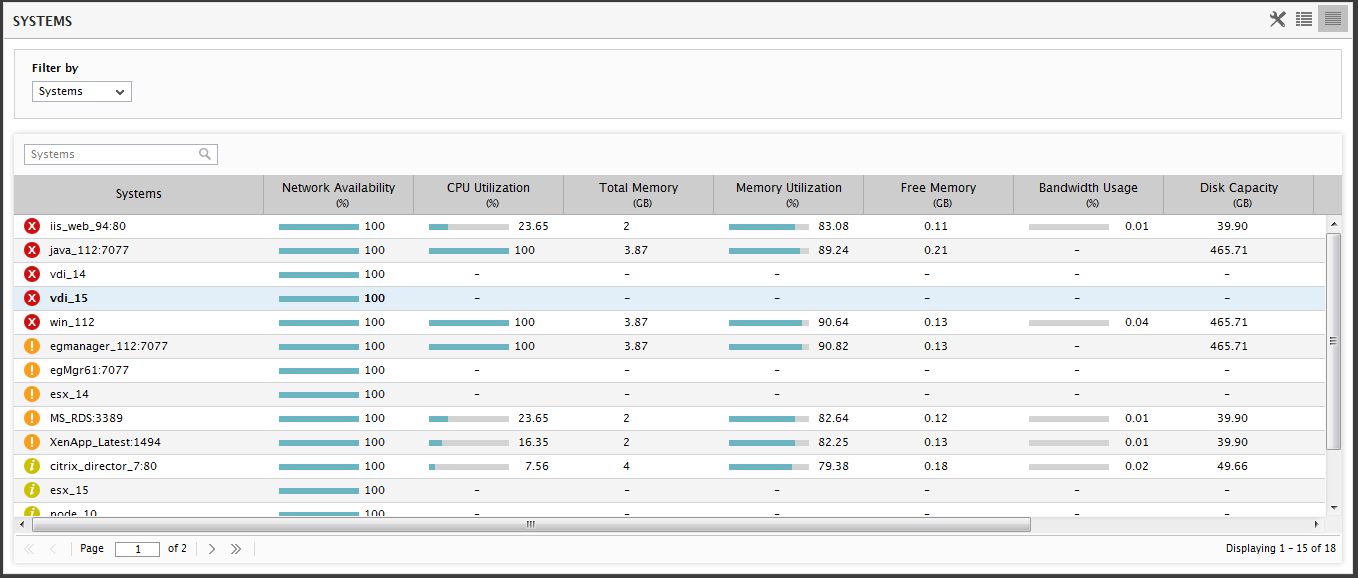
Figure 1 : Viewing a host-wise list of system components and their state
By default, the Systems option is chosen from the Filter by list. If the zones/services/segments are created by the user who is accessing the eG monitor interface, then the system components that are part of the zone/segment/service can be filtered using this list. If too many system components are managed in the target environment, then, users may find it difficult to search for the system component of their choice. eG Enterprise provides a Search text box using which users can search for the system components of their choice.
By default, eG Enterprise decides certain metrics of each system to be the key performance metrics and displays the same in the SYSTEMS page. If you wish to define the metrics of your choice as the key performance metrics for each system, then you can do so using the icon. Figure 2 will then appear.
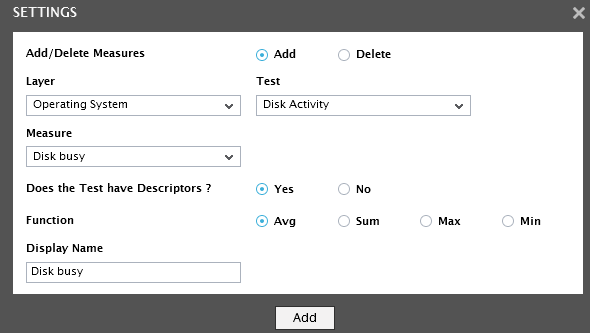
Figure 2 : Adding a new measure as the key performance metrics displayed in the SYSTEMS page
Using Figure 2, you can add/delete a measure from being displayed as a key performance metric in the SYSTEMS page. To add/delete a measure, do the following:
First specify whether you need to add or delete the measures by selecting the Add or Delete option from the Add/Delete Measures flag. Click the Add option for adding the measures.
Next, selecting a particular layer from the Layer list will populate the tests associated with the chosen layer in the Test list. Note that only the operating system level layers will be available for selection in the Layers list.
Then, select the test that reports the measure of your choice from the Test list.
Now, all the measures pertaining to the chosen test will be listed in the Measure list. Select the measure of your choice from the Measure list, and provide a display name for the measure in the Display Name text box.
Next, indicate whether the chosen test is descriptor based or not using the Does the Test have Descriptors? flag. If the test has descriptors, then set the Does the Test have Descriptors? flag to Yes. This will invoke the Function flag using which you can aggregate the measure values across all descriptors using a specific aggregate function. By default, the Avg flag will be selected against the Function flag indicating that the measure value will be displayed as the average of all the descriptors of the chosen test.
Finally click Add button to add the measure. Doing so ensures that the measure will be displayed in the SYSTEMS page for all the systems managed in the target environment.
Similarly, you can remove a measure from being displayed from the SYSTEMS page. For this purpose, set the Add/Delete Measures flag to Delete.(see Figure 3).
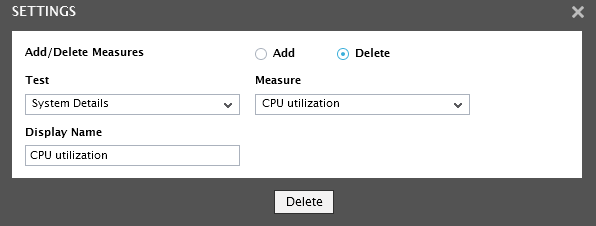
Figure 3 : Deleting a measure from the key performance metrics of the SYSTEMS page
- Select the test from the Test list and choose the measure that is to be deleted from the Measure list. Clicking the Delete button will delete the measure from the SYSTEMS page.
- Clicking on a system will lead the users to a Layers tab page that displays the layer model, tests, and measurements pertaining to that system.
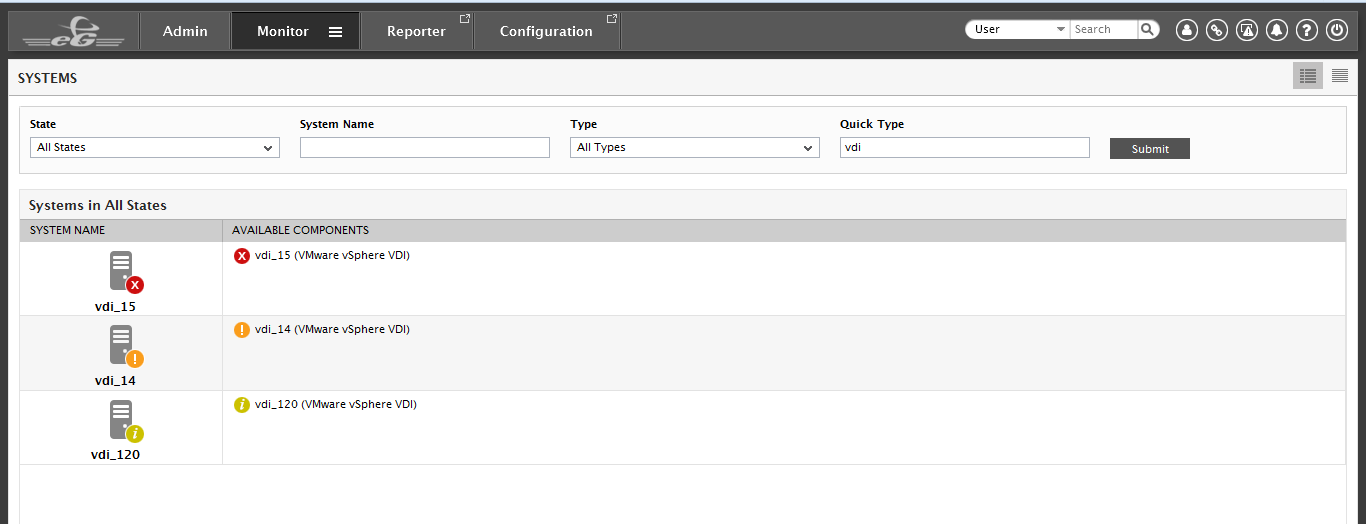
Alternately, if you wish to view a list of all the systems managed in your infrastructure, you can do so by clicking the  icon in . By default, the page that appears displays all the managed system components in the environment. Typically, the state of a system is determined by the state of one/more applications executing on it. Therefore, if a particular system is in an abnormal state, then administrators might want to know which application(s) executing on that system is causing the anomaly. To enable administrators to determine this, against every system listed in this page, eG Enterprise displays the application components deployed on that system along with the component state (see ).
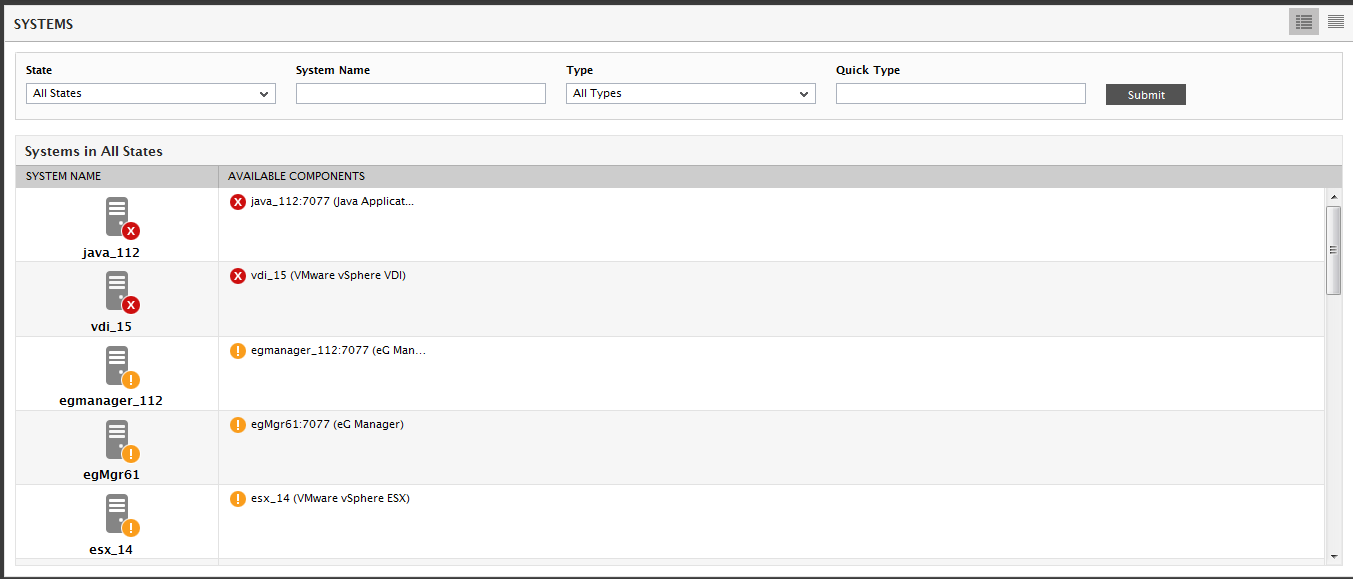
Figure 4 : Viewing the list of systems managed in the target environment
Once the problematic component on a system is identified, you can click on that component to view its layer model, tests, and measurements; this will reveal more details about the exact problem affecting component performance.
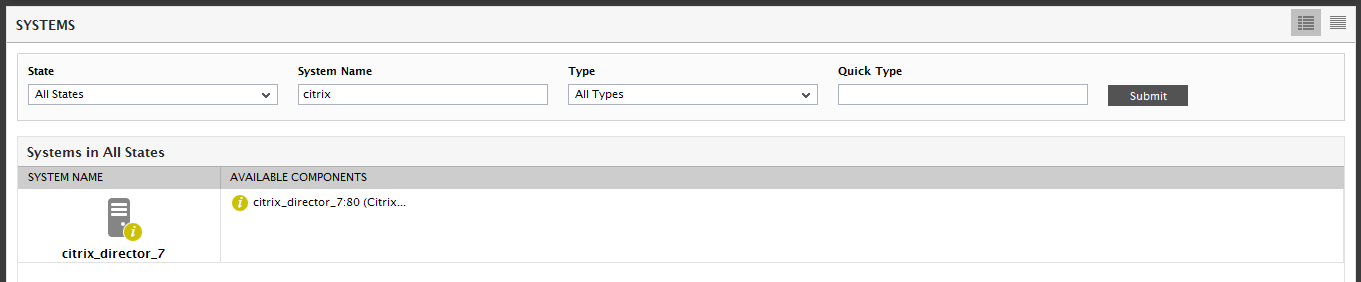
If too many systems are being currently monitored, then you can use the search options in this page to search for a particular system(s) and view its current state. To achieve this, follow the steps given below:
- To view the systems that are in a particular state, select the state of your choice from the State list.
-
To view the state of specific systems, specify the whole/part of the System name in this page. Multiple system names can be provided, separated by a white space - for example, citrix (see ). Then, click the Submit button.
-
If you want to view the state of systems that are hosting components of a particular type, select the Type to search for. You can also enter the whole/part of the component-type to search for in the Quick Type list box. This will enable you to view the status of those systems on which component-types that contain the specified search string are executing. Here again, you can search for multiple component types, by separating every type specification by a white space - for example, Web Oracle. Finally, click the Submit button.