Monitoring Zones
Large infrastructures spanning geographies can pose quite a monitoring challenge owing to the number of components involved and their wide distribution. Administrators of such infrastructures might therefore prefer to monitor the infrastructure by viewing it as smaller, more manageable business units. In eG parlance, these business units are termed zones. A zone can typically comprise of individual components, segments, services, and/or other zones that require monitoring. For example, in the case of an infrastructure that is spread across the UK, USA, and Singapore, a zone named USA can be created consisting of all the components, segments, and services that are operating in the US branch alone. The USA zone can further contain an East-coast zone and a West-coast zone to represent infrastructure and services being supported on the two coasts of the US.
While a service/segment contains a group of inter-related components with inter-dependencies between them, a zone contains a group of components, services, segments, or zones that may/may not have inter-dependencies. To know how to configure zones, refer to Chapter 2 of this manual.
Any number of zones can be configured using eG Enterprise. To quickly determine the state of the configured zones, you can login to the eG monitor interface and just click the Zones option in the Groups tile. Figure 1 will then appear listing the zones in the target environment.
Note:
If you have not configured locations (using the eG map interface) for all the managed zones, then clicking on the Zones option in Figure 1 itself will invoke the zone list of Figure 1.
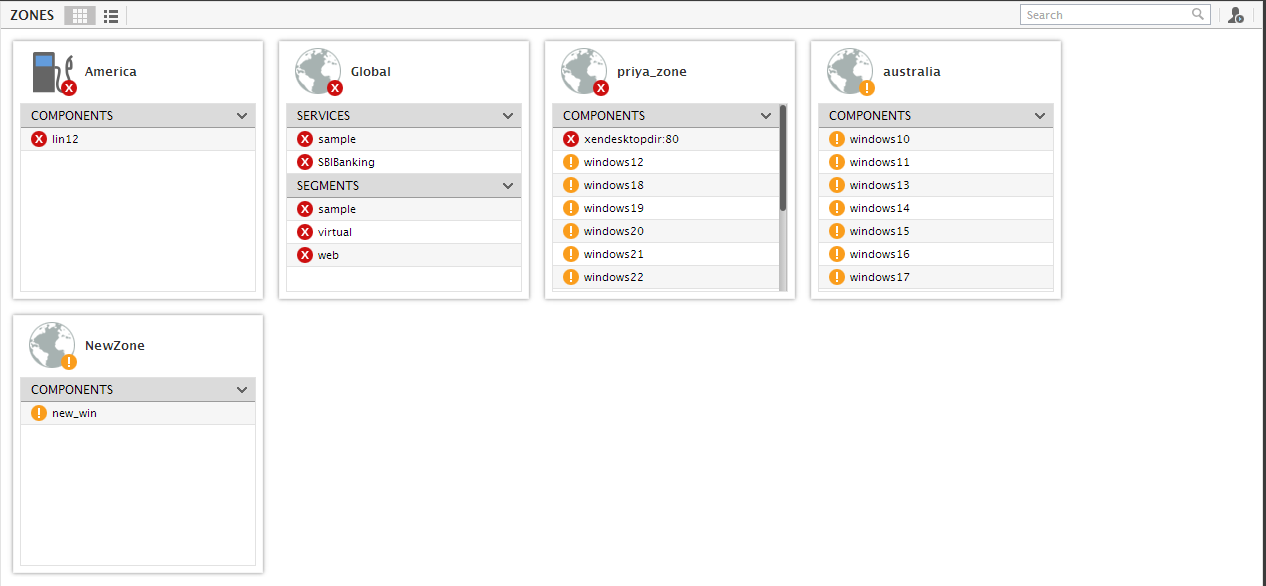
Figure 1 : The state of all the zones being monitored
For each configured zone, the zoneSpage displays the state of elements (segments/components/services/other zones) within that zone. This way, you can quickly identify those infrastructure elements that are responsible for problems with a zone.
Note:
By default, against each zone displayed in the zonES page, the top-10 Components included in that zone will be displayed. Typically, to identify the top-10 components, eG Enterprise automatically sorts all the components included in the zone on the basis of their current state, arranges the sorted list in the alphabetical order of the component names, and picks the first 10 components of this list.
If you want more number of components to be displayed against each zone, do the following:
- Login to the eG administrative interface.
- Click on the
 icon available in the Admin tab. Then, select the Monitor option from the Settings tile.
 - Click the Other Settings sub-node under the General node in the tree-structure in the monitor settings page.
- In the right panel, modify the default value 10 that is displayed in the Components count in segment/service/zone list text box.
- Click the Update button to save the changes.
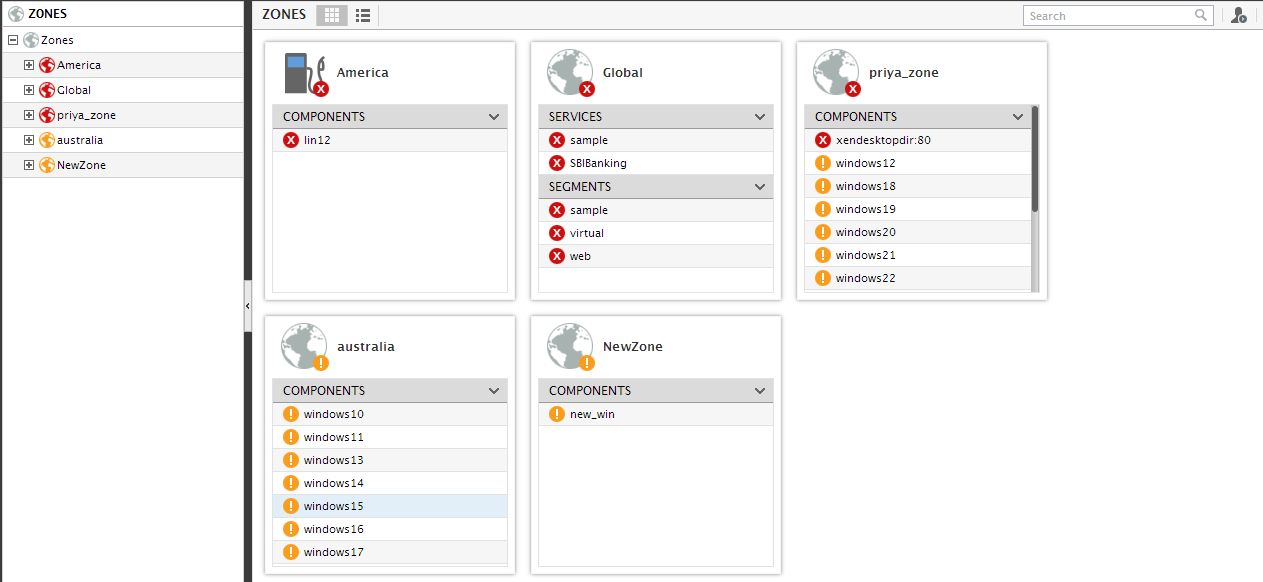
Clicking on the right-arrow button alongside the zoneS page will reveal a tree-structure in the left panel (see Figure 1). This tree-structure consists of a Zones node, which displays all the configured zones as its sub-nodes. Besides the names of the zones, these sub-nodes also indicate the current state of each zone.
If you expand a node representing a zone in the tree, you will find sub-nodes representing each type of infrastructure element that has been included in the zone. For instance, if one/more services and segments have been added to a zone, then expanding that zone's node will reveal a Services and a Segments sub-node. To know which segments and services have been added to the zone, expand the Segments and Services sub-nodes, respectively.
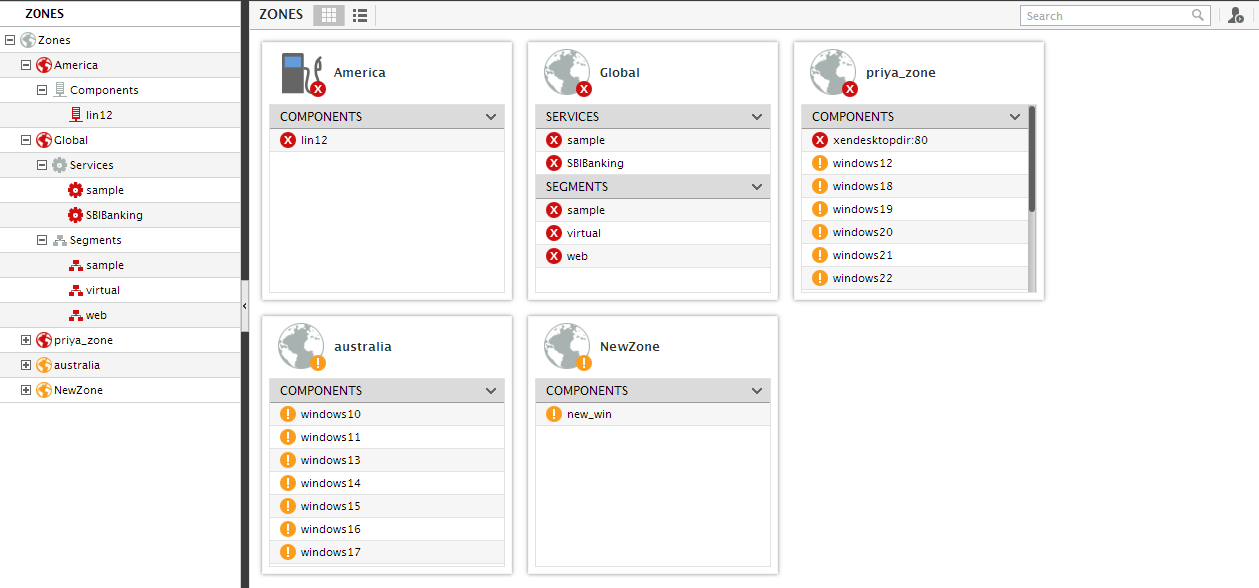
Figure 3 : Expanding the node representing a particular zone
Likewise, if a zone consists of sub-zones and independent components, then, expanding such a zone's node will reveal sub-nodes named Zones and Components, respectively. Here again, you can expand the Zones and Components sub-nodes to figure out which other zones and components have been included in the zone.
Note:
If you do not wish to view the sub-zones as a separate sub node, then you need to set the Show sub zones in Tree View flag in the OTHER SETTINGS page of the eG administrative interface to No. In that case, when the zones containing the sub-zones are expanded, the sub-zone and its associated elements will be expanded by default.
If the zone includes aggregate components, then the node representing that zone will host an Aggregates sub-node, which when expanded, will list all the aggregate components that are part of that zone and their current state.
Click on a particular segment in the tree to view the Topology of that segment, using which you can determine the root-cause of performance issues in the segment. In the same way, you can click on a particular service in the tree to view the Topology of that service and accurately diagnose the source of any slowdowns that may be experienced by that service.
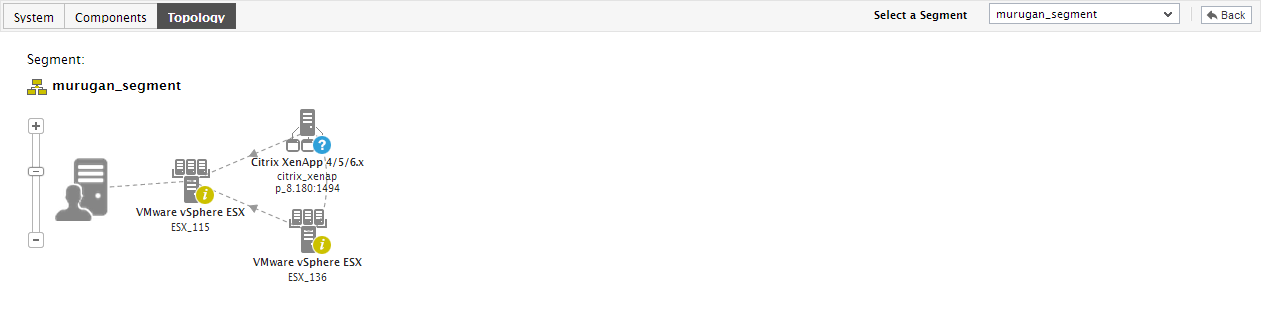
Figure 4 : The Segment Topology tab page that appears when a segment that is part of a zone is clicked in the Zones tree
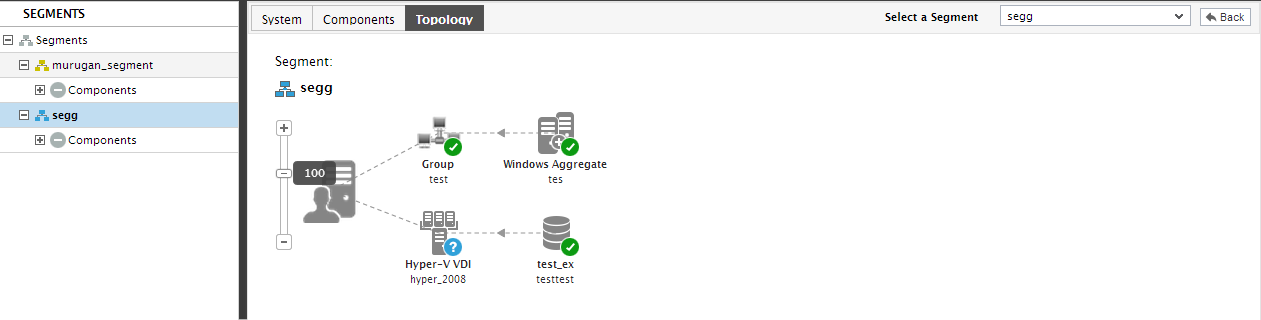
Figure 5 : The Service Topology tab page that appears when a specific service that is part of a zone is clicked in the Zones tree
When you click on a node representing a (parent) zone in the tree - i.e., if you click on any of the sub-nodes of the global Zones node in the tree - the right panel will change to display three tab pages, namely - the Systems, Components, and Details tab pages. The sections that follow will discuss each of these tab pages in detail.