NetworkInterfaces
If you want to focus only on the speed, bandwidth usage, and traffic handled by the network interfaces supported by a network device, pick the NetworkInterfaces option from the Subsystem list in your Network Dashboard. When this is done, Figure 1 will appear.
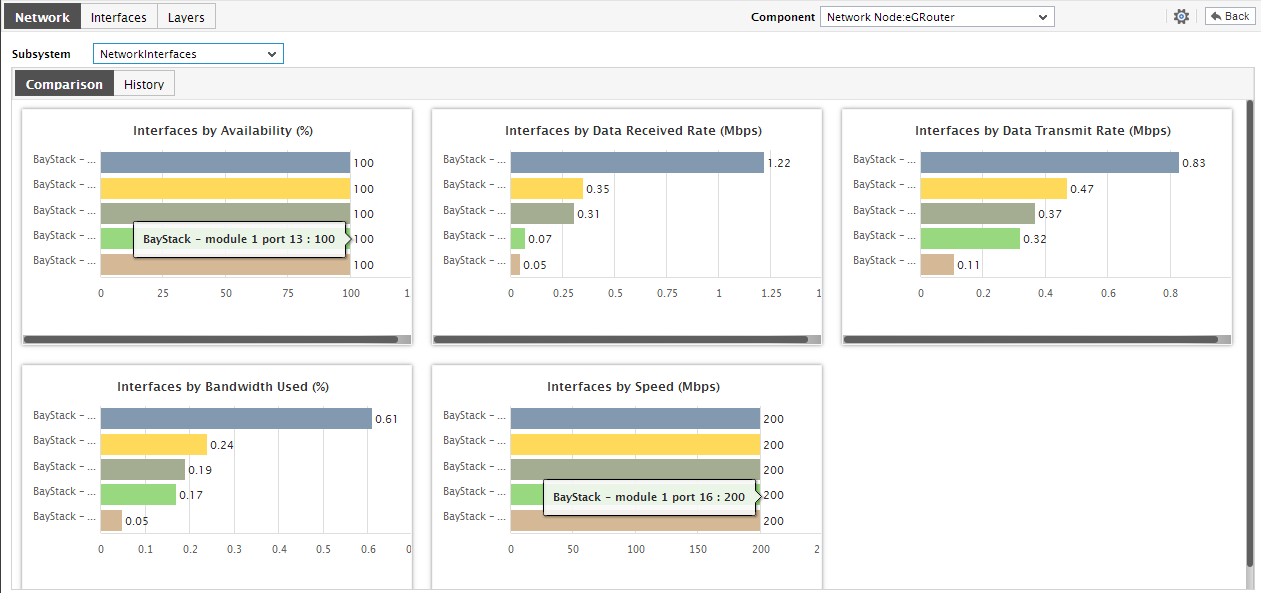
Figure 1 : The NetworkInterfaces dashboard
- Like the other sub-systems, the dashboard for the NetworkInterfaces sub-system too begins with dial graphs and digital displays. These dial and digital graphs are configured for a default set of measures - typically, these measures will be key indicators of the performance of network interfaces. If one/more of these measures are currently abnormal for a particular interface, then, these dial and digital graphs will give you a heads-up on the anomaly, and also indicate which network interface is experiencing the issue. On the other hand, if more than one network interface is experiencing performance issues or if all interfaces are operating normally, then the eG Enterprise system randomly picks a network interface and presents the default metrics extracted from that interface in the dial and digital format. If required, you can configure dial and digital displays for additional measures, or can even remove the graphs that pre-exist by deleting the corresponding measures; for this, follow the steps discussed hereunder:
- Let us now return to the dashboard. If you click on any dial/digital graph in the dashboard, you will be directly lead to the layer model page, which will display the exact measure represented by the dial/digital graph and the layer-test combination that reports the said measure.
-
The Comparison tab page below displays a series of bar charts depicting the top network interfaces in various performance areas. These bar charts enable you to quickly and accurately identify the following:
- Which network interface is operating with the maximum speed?
- Which network interface is consuming bandwidth excessively?
- Which network interface is unavailable currently?
- Which network interface is receiving data at a very high rate?
- Which network interface is sending out data at a very high rate?
-
By default, these bar charts depict the top-10 network interfaces only. To view this graph clearly, click on the corresponding bar chart. Doing so enlarges the bar chart as depicted by Figure 2.
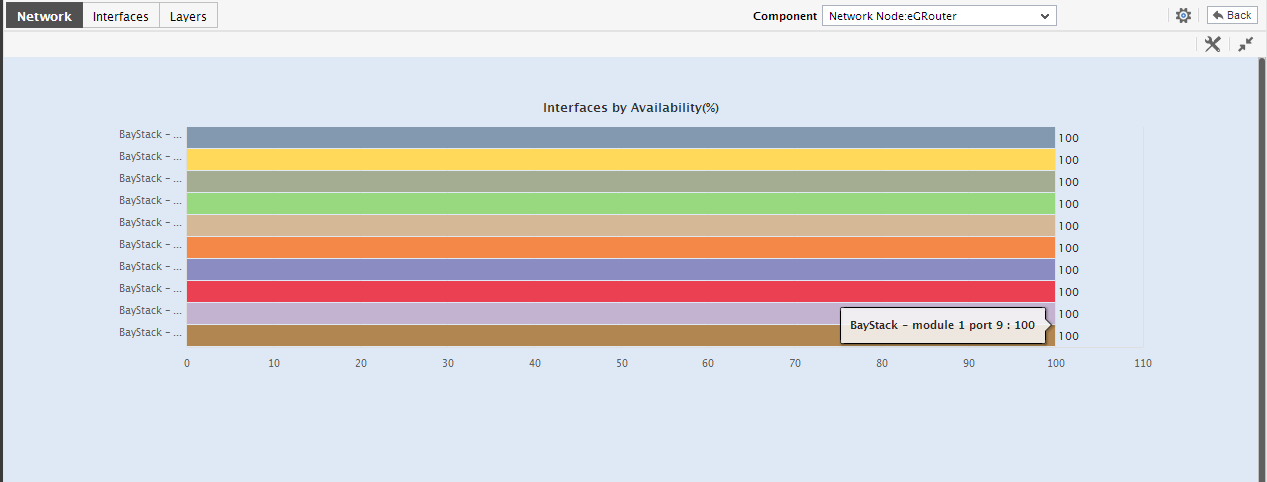
Figure 2 : A bar chart in the NetworkInterfaces dashboard that has been enlarged
- The enlarged bar chart too, by default, displays the top-10 network interfaces in the chosen performance area. For instance, if the Interfaces by Bandwidth usage chart is enlarged, then the magnified chart will display the top-10 network interfaces in terms of current bandwidth usage. Moreover, since these network interfaces are arranged in the descending order of the bandwidth usage, you can instantly identify the top bandwidth consumer. To view all the network interfaces supported by the device and the bandwidth usage of each, select all from the Show list. You can choose to view only a few of the top/poor players in a performance area, by picking a top-n or last-n option from the Show list.
- Also, note that the bar chart displays only those network interfaces that are currently supported by the device. However, sometimes, to investigate past issues, you might want to determine the top performers or the poor performers during a time period in the past. For this, click on Compare History in Figure 3. This will invoke a Timeline field, using which you can alter the Timeline of the enlarged bar chart.
-
This way, the Comparison tab page enables you to effectively compare the current performance of the network interfaces on the basis of various performance parameters, so that the erring interfaces are swiftly identified. While updates on the current state of the network interfaces can introduce you to operational errors that crept in suddenly, to identify potential anomalies, the knowledge of both current and past performance is essential. The History tab page, when clicked, provides a series of measure graphs (by default) that allow you to analyze the past performance of the network interfaces. By default, these graphs are plotted for a period of 24 hours. You can however change the timeline of the graphs on-the-fly by clicking on the Timeline link at the right, top corner of the History tab page.
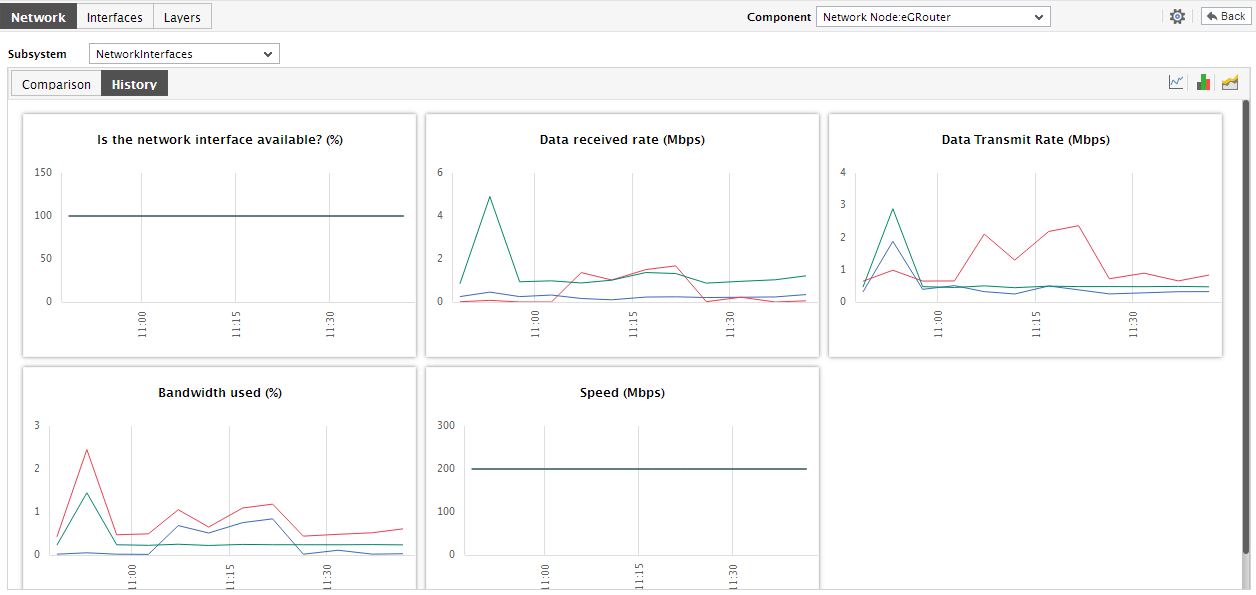
Figure 3 : The History tab page of the NetworkInterfaces dashboard
Using these measure graphs, you can determine the following:
- Were there consistent/intermittent breaks in the availability of any of the network interfaces during the specified time period?
- Did data traffic to/from any network interface increase significantly during the designated period?
- Were any irregularities noticed in load balancing across the network interfaces during the designated period?
- Was bandwidth usage optimal during the specified period? Which network interface contributed to an increase in bandwidth usage?
- Were all network interfaces operating in normal speed during the said period? Did any network interface experience significant slowdowns? If so, which one?
-
You can enlarge a measure graph by clicking on it, and thus view it more clearly (see Figure 4).
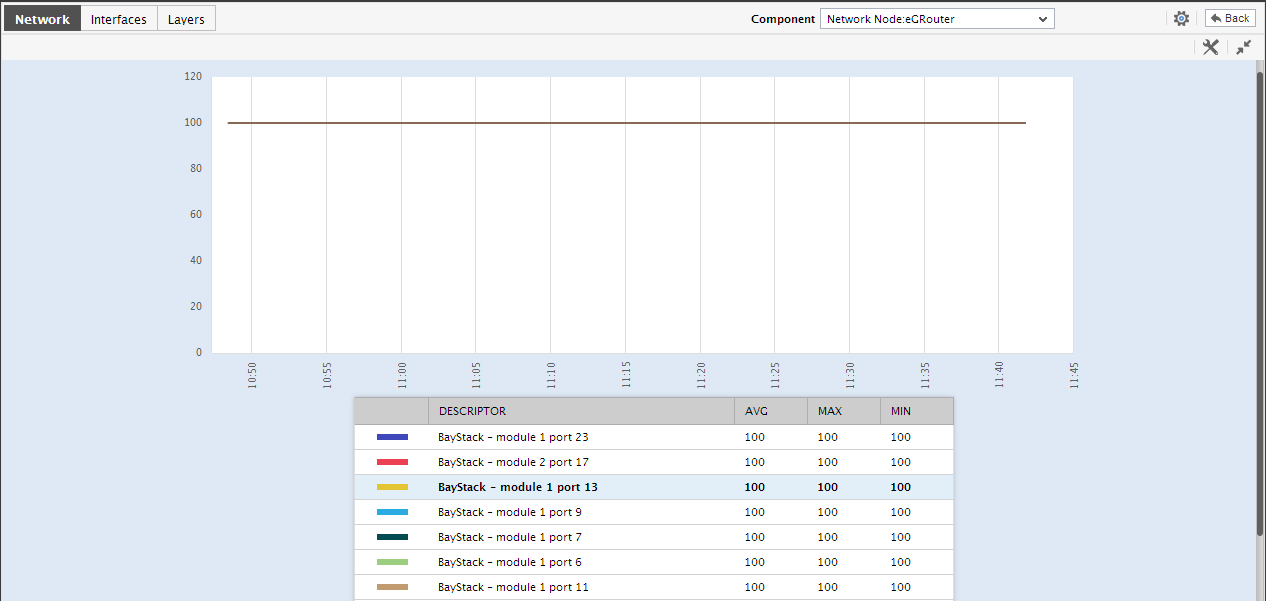
Figure 4 : An enlarged measure graph in the History tab page of the NetworkInterfaces dashboard
- Like the comparison graphs, the enlarged measure graphs also, by default, plot the values of the top-10 network interfaces supported by the device. Accordingly, the top-10 option is by default chosen from the Show list. To zoom into the performance of only a few of the top players / weak players in that performance area, pick a top-n or last-n option from the Show list.
- Besides enabling you to identify the best/worst performers in a chosen performance arena, the enlarged graph also enables you to assess performance of network interfaces across broader time periods - for this, you will have to select a different Timeline for the enlarged graph. Similarly, you can also change the dimension (3d / 2d) of a graph in its enlarged mode.