Outside View Analysis
Knowing how the VMs on a virtual host are utilizing the physical resources of the host will enable administrators to isolate resource-deficiencies at the host level, and to accurately identify resource-intensive VMs. The Outside View dashboard provided by eG Enterprise facilitates such an analysis for each VM configured on a virtual host. To view this dashboard, select the Outside view of VMs option from the Subsystem list, and pick the VM for which the outside view is to be analyzed, from the VM list.
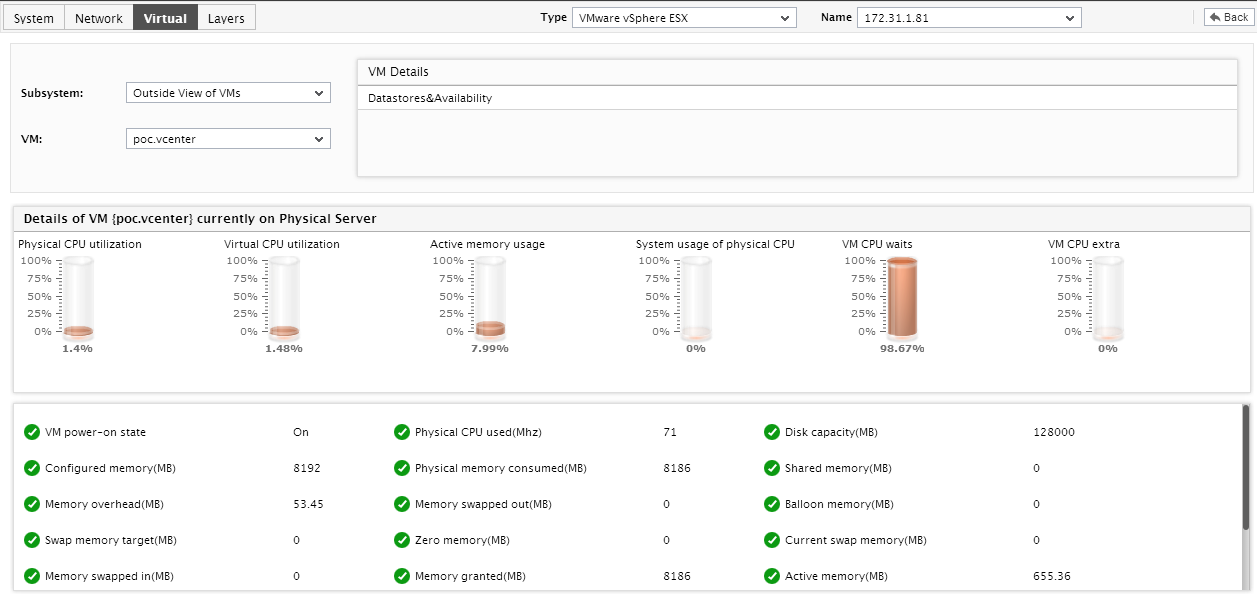
Figure 1 : The Outside view of VMs dashboard
Doing so will invoke the following details (see Figure 1):
- The vm Details section displays the IP address of the chosen VM, the operating system on which the VM runs, the datastores used by the VM and the availability of each datastore.
-
Below this section you will find a series of bar charts, each reporting the current value of a pre-configured outside view metric. From these bar charts, you can quickly figure out how that VM is utilizing the physical CPU, memory, and disk resources of the host.
Note:
You can configure what outside view statistics need to be represented using bar charts by following the steps discussed below:
- Edit the eg_dashboard.ini file in the <eg_install_dir>\manager\config directory.
-
In the [OutsideViewAnalysis] section of the file, you will find a parameter of the following format for each of the virtualization platforms that is being monitored by eG Enterprise:
<InternalComponentType>_BAR
This parameter is typically set to a comma-separated list of measures for which bar charts are to be displayed in the dashboard.
By default, this parameter is set to a pre-configured list of outside view metrics extracted from the corresponding <InternalComponentType>.
-
You can override this default setting by adding more measures to the comma-separated list, or by removing one/more existing measures. To add another measure, append an entry of the following format to the comma-separated list that follows the <InternalComponentType>_BAR parameter:
<InternalTest>:<InternalMeasure>:<DisplayName>
For instance, to add a bar chart for the Memory swap in rate measure reported by the EsxGuestDetails test test of the vSphere/ESX(i) component, your entry should be: VmEsx_i_server_BAR=. . . . . . .,EsxGuestTest:Swap_In_Rate:Swap rate
To know the internal component type, test, and measure names, refer to Page of this document.
- Finally, save the file.
-
Below the bar charts, you will find a metrics table, where pre-configured outside view metrics are displayed, and the current value and state of each metric is reported. This way, you can quickly spot any sudden change in the state or values of critical statistics.
Note:
You can configure what outside view metrics are to be displayed in the metrics table, by following the steps below:
- Edit the eg_dashboard.ini file in the <eg_install_dir>\manager\config directory.
-
In the [OutsideViewAnalysis] section of the file, you will find a parameter of the following format for each of the virtualization platforms that is being monitored by eG Enterprise:
<InternalComponentType>_data
This parameter is typically set to a comma-separated list of measures that need to appear in the metrics table in the outside view dashboard.
By default, this parameter is set to a pre-configured list of outside view metrics extracted from the corresponding <InternalComponentType>.
-
You can override this default setting by adding more measures to the comma-separated list, or by removing one/more existing measures. To add another measure, append an entry of the following format to the comma-separated list that follows the <InternalComponentType> _DATA parameter:
<InternalTest>:<InternalMeasure
For instance, to add the Memory swap in rate measure reported by the EsxGuestDetails test test of the vSphere/ESX(i) component to the metrics table, your entry should be:: VmEsx_i_server_DATA =. . . . . . ., EsxGuestTest:Swap_In_Rate:Swap rate
To know the internal component type, test, and measure names, refer to page of this document.
- Finally, save the file.