Physical Server Analysis - CPU
By default, the Virtual Dashboard allows you to focus on how the host operating system and the VMs are utilizing the physical CPU resources of the target host. Accordingly, Physical Server Analysis is chosen as the Subsystem, and CPU is chosen from the View list, by default (see Figure 1). The contents of this default CPU dashboard have been discussed below:
-
The CPU dashboard begins with dial charts that will frequently update you with the current state and values for critical CPU usage metrics related to the host operating system. You can promptly detect sudden spikes in CPU usage by the host using these dial charts.
Note:
You can configure what CPU usage statistics need to be represented using dial charts by following the steps discussed below:
- Edit the eg_dashboard.ini file in the <EG_INSTALL_DIR>\manager\config directory.
-
In the [CPUAnalysis] section of the file, you will find a parameter of the following format for each of the virtualization platforms that is being monitored by eG Enterprise:
<InternalComponentType>_GAUGE
This parameter is typically set to a comma-separated list of measures for which dial charts are to be displayed in the dashboard.
By default, this parameter is set to a pre-configured list of CPU-related metrics extracted from the corresponding <InternalComponentType>.
-
You can override this default setting by adding more measures to the comma-separated list, or by removing one/more existing measures. To add another measure, append an entry of the following format to the comma-separated list that follows the <InternalComponentType>_GAUGE parameter:
<InternalTest>:<InternalMeasure>:<DisplayName>
For instance, to add a dial chart for the Physical CPU Usage measure reported by the CPU - ESX test of the VMware vSphere ESX component, your entry should be: VmEsx_i_server_GAUGE=. . . . . . .,EsxCpuSummaryTest:Usage:Physical server CPU usage
To know the internal component type, test, and measure names, refer to page of this document.
-
Finally, save the file.
Note that dial charts can be used to represent only those measures that report values in percentage.
-
Clicking on a dial chart will lead you to the Layer tab page, where you can view the layer and test that reported the measure represented by that dial chart (see ).
Figure 1 : Clicking on a dial chart in the Physical Server CPU Analysis dashboard
-
Below the dial charts, you will find a default collection of comparison bar charts that typically compare CPU usage across the host's processors, the host's subsystems, the physical CPU usage across VMs, and the virtual CPU usage across VMs. Using these graphs, resource-intensive processors, subsystems, and VMs can be accurately identified.
Note:
You can configure what CPU usage statistics need to be represented using the comparison bar charts, by following the steps discussed below:
- Edit the eg_dashboard.ini file in the <EG_INSTALL_DIR>\manager\config directory.
-
In the [CPUAnalysis] section of the file, you will find a parameter of the following format for each of the virtualization platforms that is being monitored by eG Enterprise:
<InternalComponentType>
This parameter is typically set to a comma-separated list of measures for which comparison bar charts are to be displayed in the dashboard.
By default, this parameter is set to a pre-configured list of CPU-related metrics extracted from the corresponding <InternalComponentType>.
-
You can override this default setting by adding more measures to the comma-separated list, or by removing one/more existing measures. To add another measure, append an entry of the following format to the comma-separated list that follows the <InternalComponentType> parameter:
<InternalTest>:<InternalMeasure>:<DisplayName>
For instance, to add a comparison graph for the VM CPU Extra measure reported by the EsxGuestDetails test of the VMware vSphere ESX component, your entry should be: VmEsx_i_server =. . . . . . .,EsxGuestTest:Cpu_extra:VM CPU Extra
To know the internal component type, test, and measure names, refer to page of this document.
-
Finally, save the file.
It is recommended that you configure comparison graphs for only those measures that support descriptors.
-
If a comparison graph appears too cluttered, you can view that graph more clearly by enlarging it. To do so, click on that graph. The graph will then appear as depicted below:
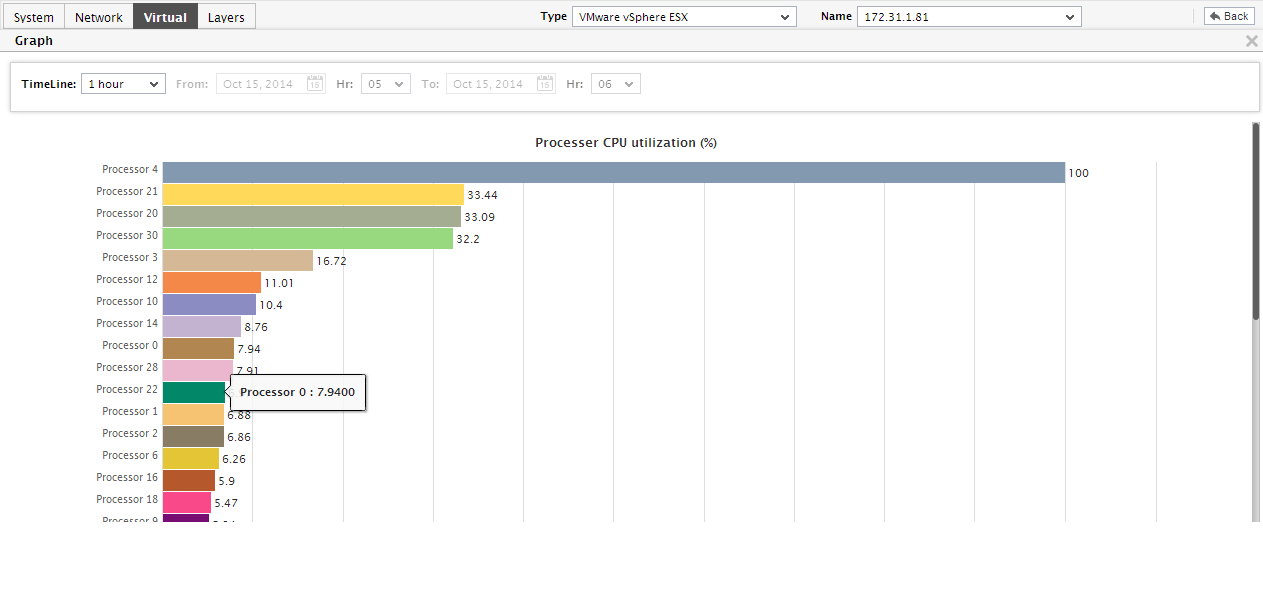
Figure 2 : Enlarging a comparison bar chart in the Physical Server CPU Analysis dashboard
- By default, in the enlarged mode, the comparison bar chart will display all the compared elements (i.e., descriptors). This is why, the Show list is set to all by default. If you want the graph to display only a few best or a few worst players in a particular area, then, pick a top-n or last-n option from the Show list. To collapse the enlarged graph, click on it again.
-
Back in the dashboard, you will find that a Details of VMs table follows the comparison bar charts. By default, this table compares the physical and virtual CPU usage of each of the VMs so that, you can clearly identify the following:
- The VM causing a severe dent in the physical resources of the host;
- The VM using the allocated CPU resources excessively
By default, this table is sorted in the descending order of the Physical CPU utilization column. To sort the table in the ascending order of the same column, click on the down arrow button that appears adjacent to the column heading, Physical CPU utilization (%). To sort the table on the basis of the values of another column, click on the title of the corresponding column.
Note:
You can configure additional measure columns to the Details of VMs table by following the procedure discussed below:
- Edit the eg_dashboard.ini file in the <EG_INSTALL_DIR>\manager\config directory.
-
In the [CPUAnalysis] section of the file, you will find a parameter of the following format for each of the virtualization platforms that is being monitored by eG Enterprise:
<InternalComponentType>_DATA
This parameter is typically set to a comma-separated list of measures that will appear as columns in the Details of VMs table.
By default, this parameter is set to a pre-configured list of CPU usage statistics extracted from each VM on the corresponding <InternalComponentType>.
-
You can override this default setting by adding more measures to the comma-separated list, or by removing one/more existing measures. To add another measure, append an entry of the following format to the comma-separated list that follows the <InternalComponentType>_DATA parameter:
<InternalTest>:<InternalMeasure>
For instance, to add a column for the VM CPU Extra measure reported by the EsxGuestDetails test of the VMware vSphere ESX component, your entry should be: VmEsx_i_server_DATA =. . . . . . .,EsxGuestTest:Cpu_extra
To know the internal component type, test, and measure names, refer to page of this document.
- Finally, save the file.
-
To historically analyze the physical CPU usage of the host and the VMs, you can view historical measure graphs in your dashboard, instead of the default comparison bar charts. To do this, click on the
 icon at the right, top corner of your dashboard. This will result in the display of measure graphs, plotted for a default duration of 1 hour, for each of the measures for which comparison bar charts were originally displayed.
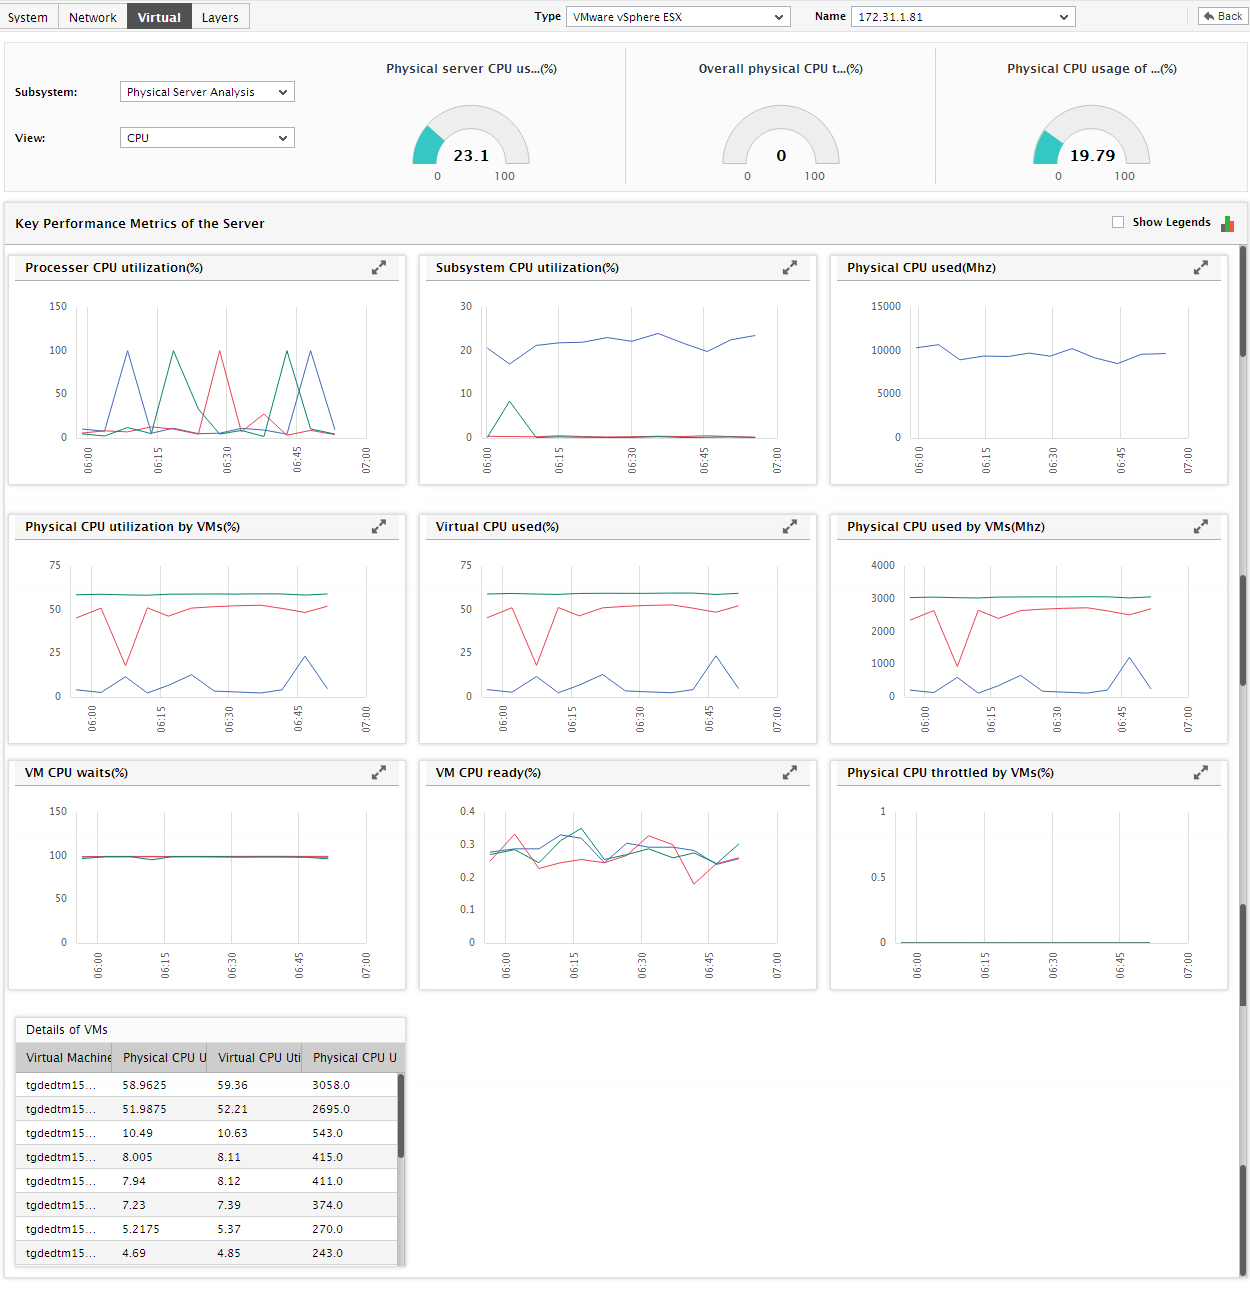
Figure 3 : Viewing historical measure graphs in the Physical Server CPU Analysis dashboard
- In the event of a contention for CPU resources, you can use these measure graphs to understand how CPU usage has varied during the last hour, and when the CPU contention actually began.
-
To view a measure graph more clearly, click on it. This will enlarge the graph (see Figure 4).
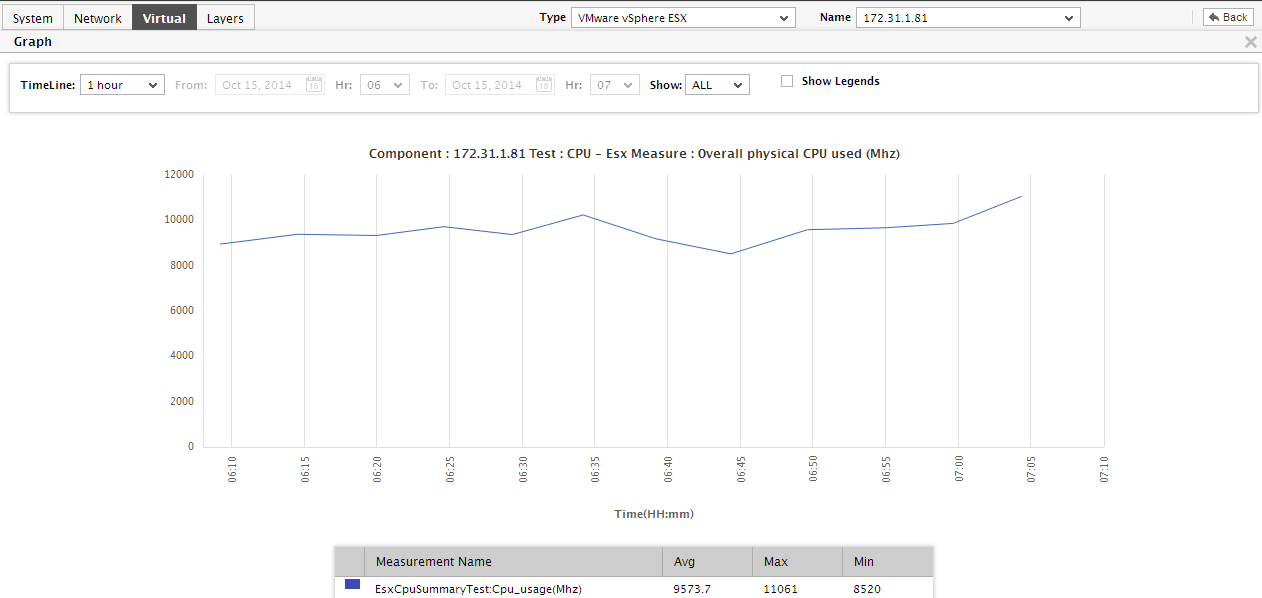
Figure 4 : Enlarging a measure graph in the Physical Server CPU Analysis dashboard
- In the enlarged mode, you can change the Timeline of the graph. You can also pick a top-n or last-noption from the Show list to analyze the time-of-day variations in the performance of a few best/worst players in the chosen performance arena. To return to the dashboard, click on the enlarged graph.