Physical Server Analysis - Disk
To quickly analyze disk activity and disk space usage by the virtual host and its VMs, and to precisely point to the VMs that are consuming too much disk space, select Disk from the View list. Figure 1 will then appear.
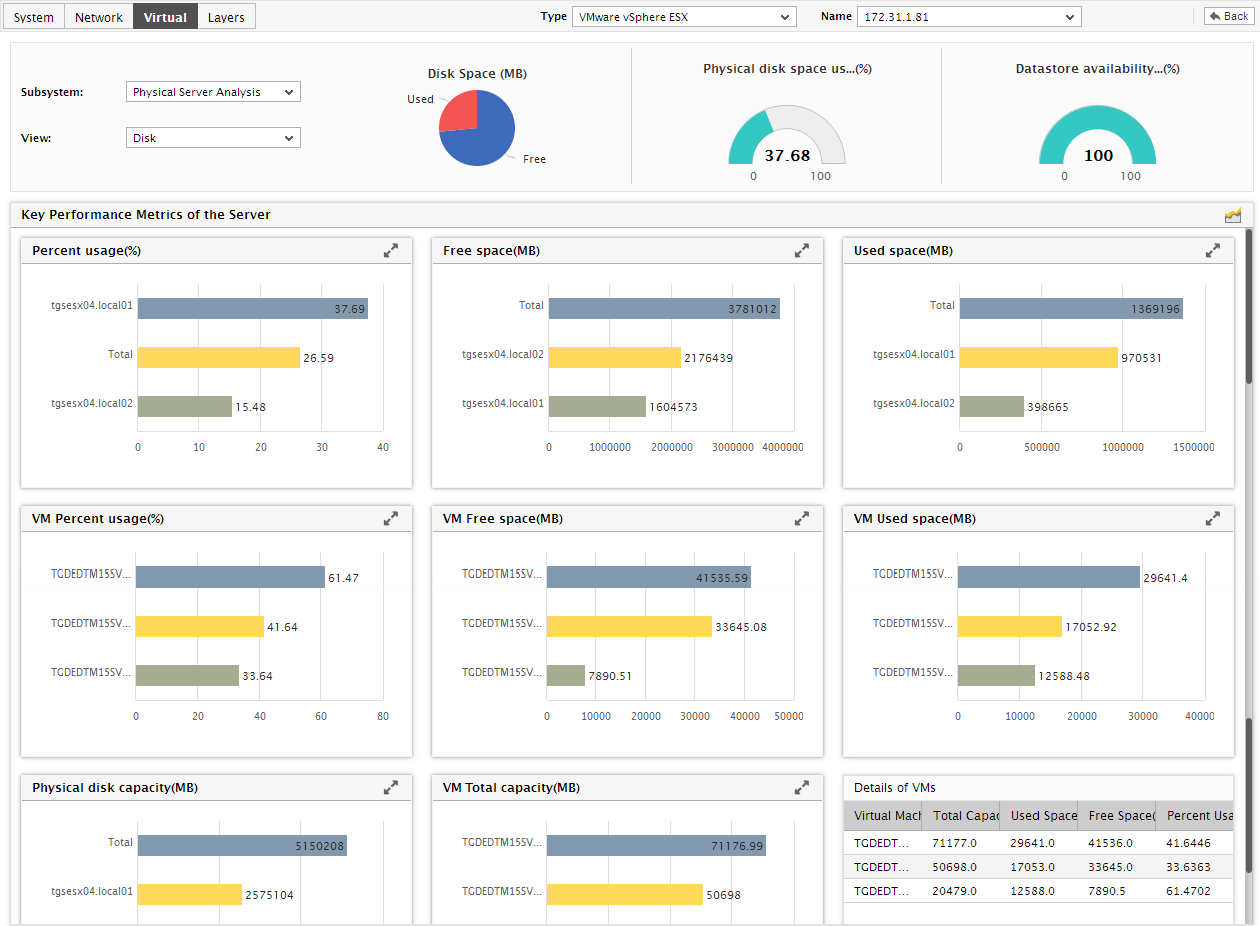
Figure 1 : The Physical Server Memory Disk dashboard
The contents of Figure 1 have been detailed below:
-
A glance at the pie chart in the Disk dashboard will indicate to you whether a space crunch exists on the host or not.
Note:
By default, the pie chart will denote the Free space and Used space on the target virtual host. If you want the pie chart to represent more measures, do the following:
- Edit the eg_dashboard.ini file in the <EG_INSTALL_DIR>\manager\config directory.
-
In the [DiskAnalysis] section of the file, you will find a parameter of the following format for each of the virtualization platforms that is being monitored by eG Enterprise:
<InternalComponentType>_PIE
This parameter is typically set to a comma-separated list of measures that will be represented in the pie chart in the Disk dashboard.
By default, this parameter is set to the Free space and Used space measures.
-
You can override this default setting by adding more measures to the comma-separated list, or by removing one/more existing measures. To add another measure, append an entry of the following format to the comma-separated list that follows the <InternalComponentType>_PIE parameter:
<InternalTest>:<InternalMeasure>:<DisplayName>
For instance, to make sure that the pie chart also represents the value of the Physical disk capacity measure reported by the Datastores - Esx test of the VMware vSphere ESX component, your entry should be: VmEsx_i_server_PIE=. . . . . . .,EsxDiskUsageTest:Total_capacity:Physical disk capacity
To know the internal component type, test, and measure names, refer to page of this document.
-
The dial charts in the dashboard indicate the current state and values for critical space usage metrics related to the host operating system. You can promptly detect which disk partition / storage adapter on the host is currently facing a space crunch, using these dial charts.
Note:
You can configure what disk space usage statistics need to be represented using dial charts by following the steps discussed below:
- Edit the eg_dashboard.ini file in the <EG_INSTALL_DIR>\manager\config directory.
-
In the [DiskAnalysis] section of the file, you will find a parameter of the following format for each of the virtualization platforms that is being monitored by eG Enterprise:
<InternalComponentType>_GAUGE
This parameter is typically set to a comma-separated list of measures for which dial charts are to be displayed in the dashboard.
By default, this parameter is set to a pre-configured list of space usage-related metrics extracted from the corresponding <InternalComponentType>.
-
You can override this default setting by adding more measures to the comma-separated list, or by removing one/more existing measures. To add another measure, append an entry of the following format to the comma-separated list that follows the <InternalComponentType>_GAUGE parameter:
<InternalTest>:<InternalMeasure>:<DisplayName>
For instance, to add a dial chart for the Percent usage measure reported by the DiskSpace - Console test of the VMware vSphere ESX component, your entry should be: VmEsx_i_server_GAUGE=. . . . . . .,CSLDiskSpaceTest:Percent usage:Percent usage
- To know the internal component type, test, and measure names, refer to page of this document.
-
Finally, save the file.
Note that dial charts can be used to represent only those measures that report values in percentage.
- Clicking on a dial chart will lead you to the Layer tab page, where you can view the layer and test that reported the measure represented by that dial chart.
-
Below the dial charts, you will find a default collection of comparison bar charts that reveal how disk space is utilized by the disk partitions on the host, and how the VMs use the disk space allocated to them. Using these graphs, disk partitions and VMs that use their disk space resources excessively, can be clearly identified.
Note:
You can configure what space usage statistics need to be represented using the comparison bar charts, by following the steps discussed below:
- Edit the eg_dashboard.ini file in the <EG_INSTALL_DIR>\manager\config directory.
-
In the [DiskAnalysis] section of the file, you will find a parameter of the following format for each of the virtualization platforms that is being monitored by eG Enterprise:
<InternalComponentType>
This parameter is typically set to a comma-separated list of measures for which comparison bar charts are to be displayed in the dashboard.
By default, this parameter is set to a pre-configured list of disk space usage-related metrics extracted from the corresponding <InternalComponentType>.
-
You can override this default setting by adding more measures to the comma-separated list, or by removing one/more existing measures. To add another measure, append an entry of the following format to the comma-separated list that follows the <InternalComponentType> parameter:
<InternalTest>:<InternalMeasure>:<DisplayName>
For instance, to add a comparison graph for the Percent usage measure reported by the DiskSpace - Console test of the vSphere/ESX(i) component, your entry should be: VmEsx_i_server =. . . . . . .,CSLDiskSpaceTest:Percent_usage:Percent usage
To know the internal component type, test, and measure names, refer to page of this document.
-
Finally, save the file.
It is recommended that you configure comparison graphs for only those measures that support descriptors.
-
If a comparison graph appears too cluttered, you can view that graph more clearly by enlarging it. To do so, click on that graph. The graph will then appear as depicted below:
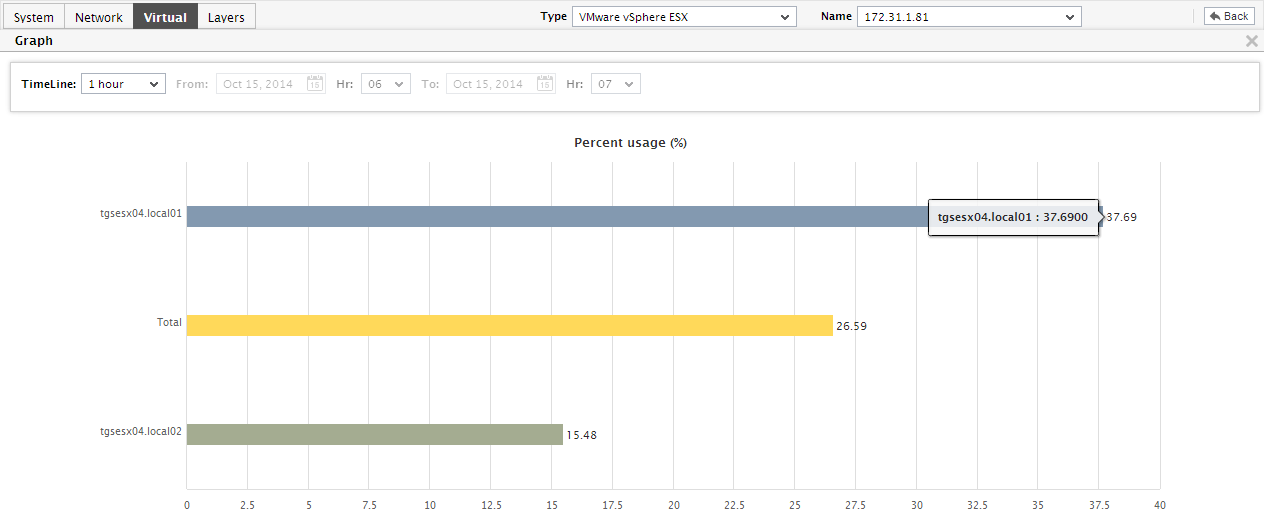
Figure 2 : Enlarging a comparison bar chart in the Physical Server Disk Analysis dashboard
- By default, in the enlarged mode, the comparison bar chart will display all the compared elements (i.e., descriptors). This is why, the Show list is set to all by default. If you want the graph to display only a few best or a few worst players in a particular area, then, pick a top-n or last-n option from the Show list.
-
Back in the dashboard, you will find that a Details of VMs table follows the comparison bar charts. By default, this table compares the space usage of the VMs configured on the target host so that, you can clearly identify the VM that may soon run out of space
By default, this table is sorted in the descending order of the Total capacity column. To sort the table in the ascending order of the same column, click on the down arrow button that appears adjacent to the column heading, Total capacity (GB). To sort the table on the basis of the values of another column, click on the title of the corresponding column.
Note:
You can configure additional measure columns for the Details of VMs table by following the procedure discussed below:
- Edit the eg_dashboard.ini file in the <EG_INSTALL_DIR>\manager\config directory.
-
In the [DiskAnalysis] section of the file, you will find a parameter of the following format for each of the virtualization platforms that is being monitored by eG Enterprise:
<InternalComponentType>_DATA
This parameter is typically set to a comma-separated list of measures that will appear as columns in the Details of VMs table.
By default, this parameter is set to a pre-configured list of space usage statistics extracted from each VM on the corresponding <InternalComponentType>.
-
You can override this default setting by adding more measures to the comma-separated list, or by removing one/more existing measures. To add another measure, append an entry of the following format to the comma-separated list that follows the <InternalComponentType>_DATA parameter:
<InternalTest>:<InternalMeasure>
For instance, to add a column for the Disk reads measure reported by the EsxGuestDetails test of the VMWare vSphere VDI component, your entry should be: VmEsx_i_server_DATA =. . . . . . .,EsxGuestTest:Reads
To know the internal component type, test, and measure names, refer to page of this document.
- Finally, save the file.
-
To historically analyze the disk space usage of the host and the VMs, you can view historical measure graphs in your dashboard, instead of the default comparison bar charts. To do this, click on the
 icon at the right, top corner of your dashboard. This will result in the display of measure graphs, plotted for a default duration of 1 hour, for each of the measures for which comparison bar charts were originally displayed.
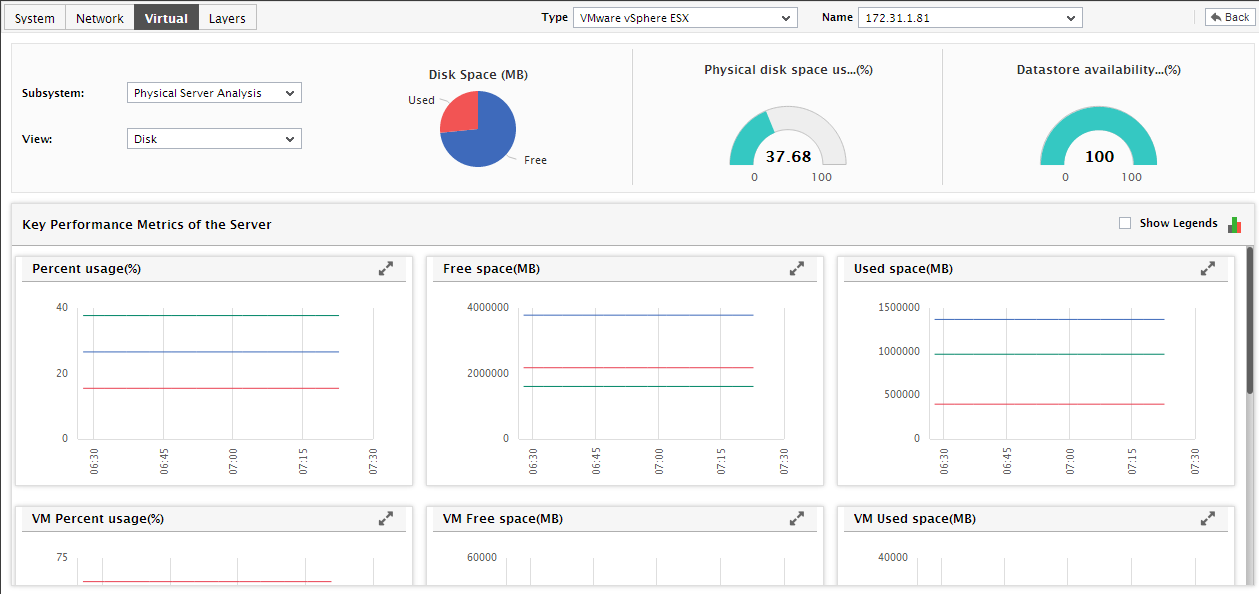
Figure 3 : Viewing historical measure graphs in the Physical Server Memory Analysis dashboard
- In the event of a space crunch, you can use these measure graphs to understand how disk space was used by the host and the VMs during the last hour, and when the space erosion actually began.
-
To view a measure graph more clearly, click on it. This will enlarge the graph (see Figure 4).
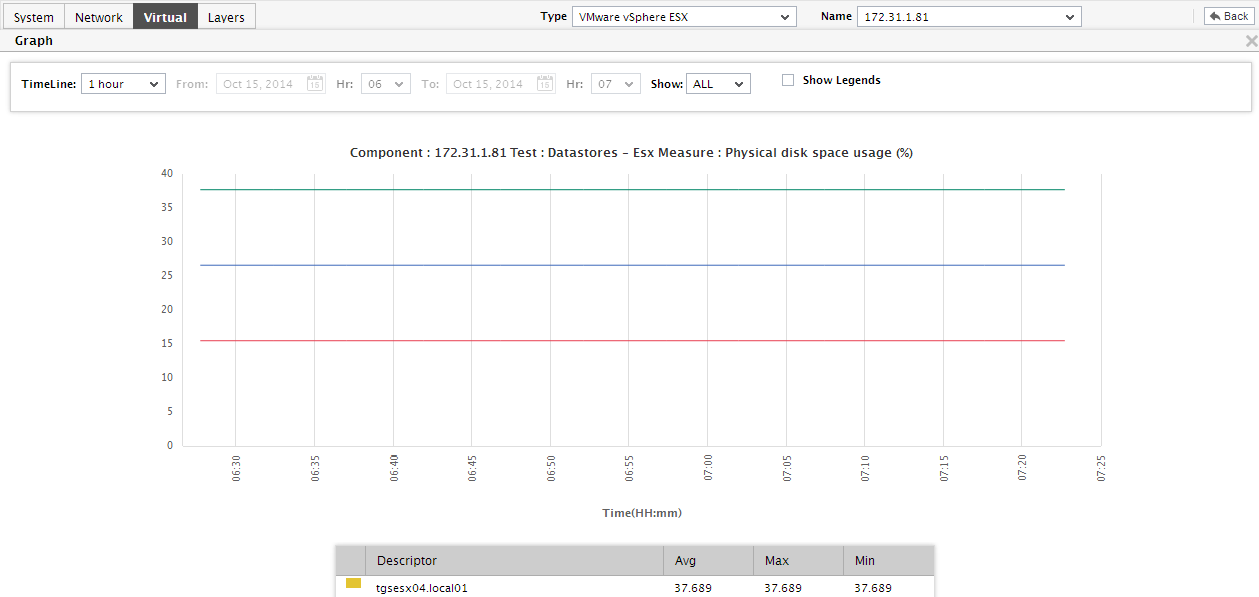
Figure 4 : Enlarging a measure graph in the Physical Server Memory Analysis dashboard
- In the enlarged mode, you can change the Timeline of the graph. You can also pick a top-n or last-n option from the Show list to analyze the time-of-day variations in the performance of a few best/worst players in the chosen performance arena. To return to the dashboard, click on the enlarged graph.