Role based Monitoring Views
Monitor Users
The previous sections explained how the supermonitor holds unrestricted access to monitor the entire environment. The interface presented by the system to the other monitor users is similar to the supermonitor’s view. The key difference between the monitor and the supermonitor users is that the monitor users are restricted to the services, segments, zones, and independent components that have been associated with them. Moreover, using the virtual manager concept, the eG manager tracks alarms individually for each user, and can generate personalized alerts for each user. To demonstrate this difference, let’s take the example of monitor users john and elvis who have been added via the eG administrative interface. Let us begin by exploring user john’s view of the monitored infrastructure. Assume that the following infrastructure elements have been explicitly associated with user john:
|
Zone |
east_coast |
|
Service |
buy.abc.com |
|
Segment |
None |
|
Components |
None |
Figure 1 : Table listing the infrastructure elements ‘directly’ assigned to user john
Figure 1 depicts the Monitor Dashboard for user john.
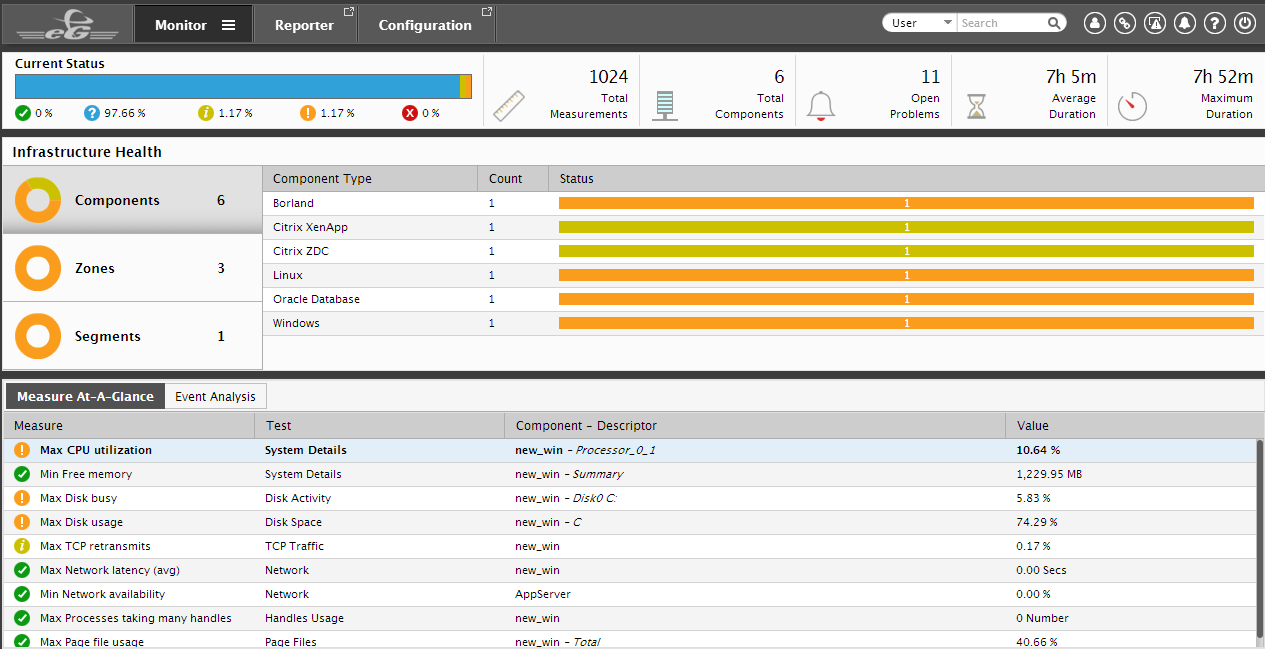
Figure 2 : Monitor Dashboard of user john
The Infrastructure Health section of Figure 2 defines user john’s monitoring scope. Let us first focus on the Zones bar in the Infrastructure Health section of Figure 2. According to the Zones bar, john has the right to monitor two zones, of which one is currently in a Critical state. According to the table in Figure 3 however, only one zone has been assigned to user john for monitoring. While it can be assumed that the east_coast zone is one of the zones, the key questions are what is the other zone, what is its current state, and why is there a mismatch between the zone assignments indicated by Figure 4.294 and the Monitor Dashboard of Figure 3. To find the answers, first, click on the Zones label in the Infrastructure Health section of Figure 2. Figure 3 then appears revealing the complete list of zones in john’s monitoring purview.
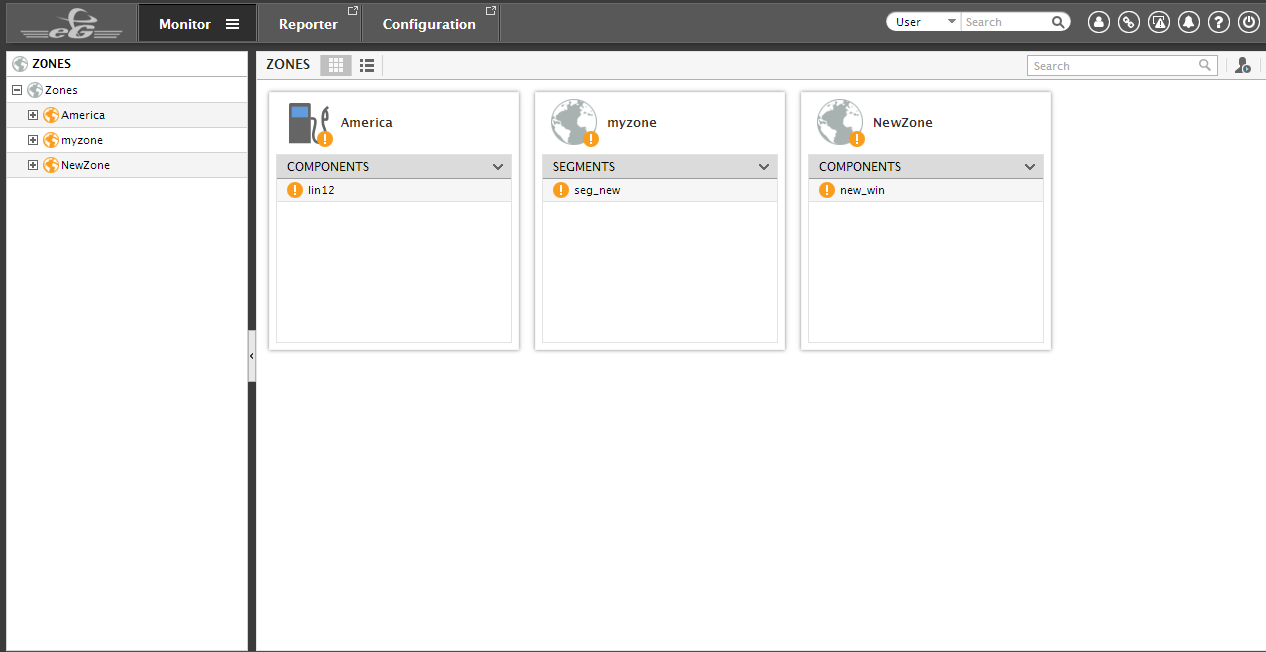
Figure 3 : The zones monitored by user john
From Figure 3, it can be inferred that besides the America zone that is currently in a Major state, a newzone (which is in the Normal state) is also included in john’s view. To know how the newzone got included in john’s monitoring scope and to diagnose the root-cause of the Critical issues with the east_coast zone, click on east_coast zone in Figure 3.
A Zone Dashboard then appears (see Figure 4) indicating the overall health of the east_coast zone. The Infrastructure Health section of the Zone Dashboard (see Figure 4) further reveals how many sub zones, segments, services, and components exist within the america, and the current state of these zone elements. From Figure 4, we can infer that the America zone consists of one subzone, one segment, and seven components.
You can even click on the respective bars in the Infrastructure Health section to know more about the problems (if any) affecting the performance of the corresponding zone elements.
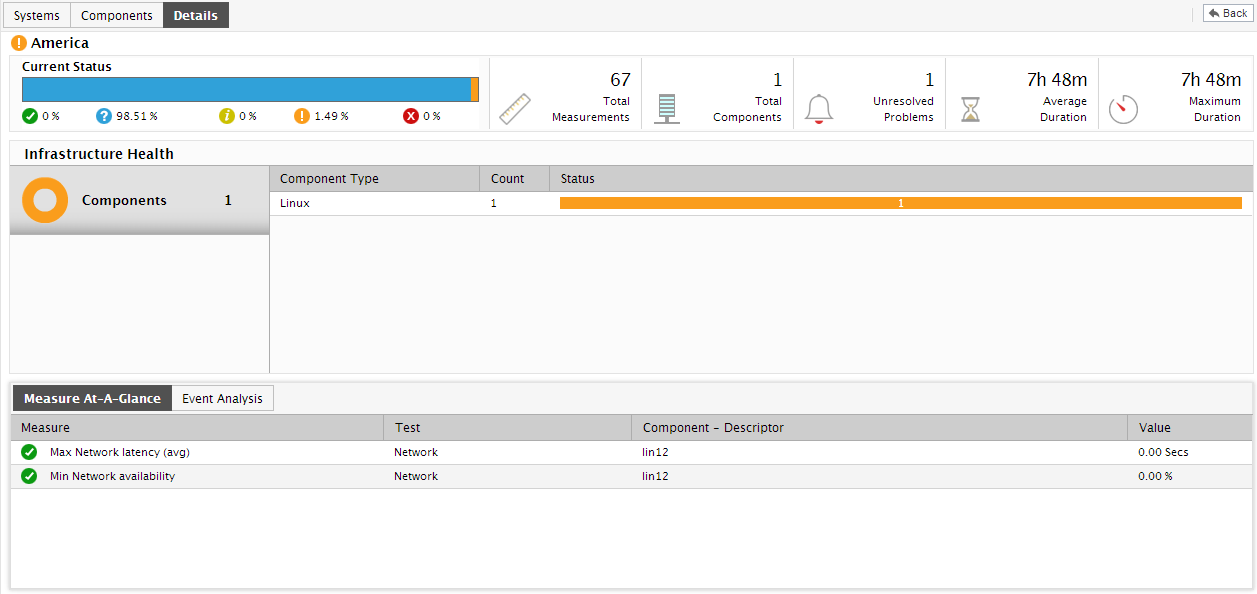
Figure 4 : Dashboard view of the America zone assigned to user john
In the case of our example therefore, clicking on the Sub Zones bar will reveal that a newzone exists within the America zone and is currently in the Normal state (see Figure 4). This is the same zone that appeared in the zone list page of Figure 5, which displays the zones present in user john’s view.
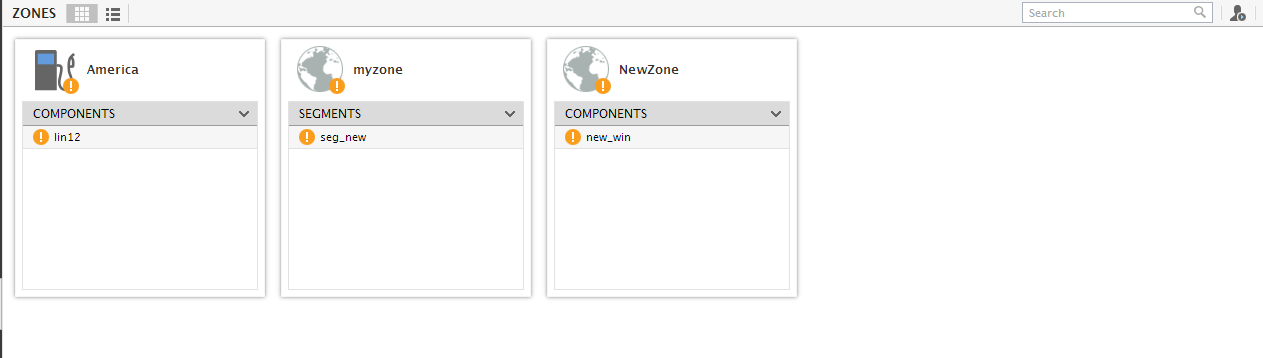
Figure 5 : Health of the newyork_zone within the east_coast zone assigned to user john
We can thus conclude that the Monitor Dashboard of a user and the zone list page (of Figure 5) not only consider the zones directly assigned to that user, but also take into account the sub-zones within these zones. This explains why user john’s Monitor Dashboard and zone list page included the sub-zone of east_coast zone, the newyork_zone.
Similarly, clicking on the Segments bar in Figure 6 will reveal that the east_coast zone consists of a segment named seg-a that is currently facing critical issues (see Figure 6).
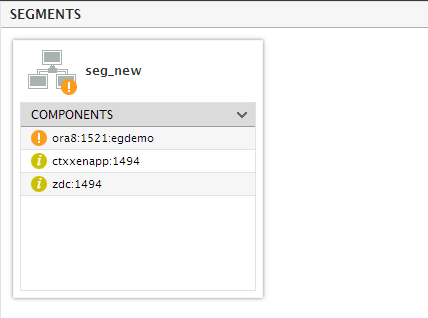
Figure 6 : Health of seg-a within the east_coast zone assigned to user john
Let us now close the Zone Dashboard and return to the Infrastructure Health section of the Monitor Dashboard (see Figure 7) of user john. This time, let us focus on the Services bar. You can see that the service that has been directly assigned to user john is the cause for concern. According to Figure 6, a web site service named buy.abc.com is the problem service. Clicking on the Services bar invokes Figure 6, which also indicates that the buy.abc.com site is in a Critical state. You can further investigate the critical problem with the web site service, by clicking on buy.abc.com in Figure 6. This will reveal the Transactions tab page of the Service dashboard, where the names and state of the transactions mapped to the buy.abc.com web site will be listed. Clicking on a problem transaction there will lead you straight to the Topology tab page, using which you can accurately isolate the root-cause of the problem.
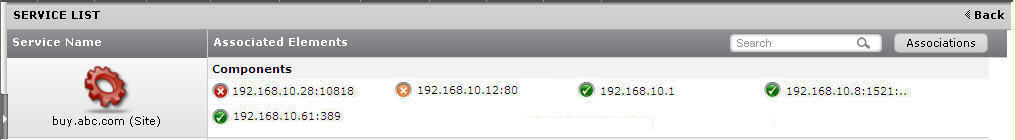
Figure 7 : Services associated with user john
Once again, return to the Monitor Dashboard of Figure 7 This time, take a look at the Segments bar in the Infrastructure Health section of the dashboard. According to the Segments bar, user john is monitoring one segment, which is currently experiencing Critical issues. However, Figure 8 has a different story to tell - apparently, no segments were explicitly allocated to user john while his profile was created in the eG administrative interface. Similarly, while Figure 7 holds that no components were directly assigned to user john, the Components bar (in the Infrastructure Health section) and the Components At-A-Glance section (in Figure 9) indicate that 7 components are under john’s monitoring purview. The question now is, where do these 7 components and the single segment come from? Let us proceed to figure this out.
In the eG Enterprise system, when a zone is directly associated with a user, all infrastructure elements included in that zone are automatically assigned to that user. This implies that while explicitly assigning the east_coast zone to john, all the infrastructure elements within the east_coast zone also got added to john’s view automatically. We can thus infer that the Segments bar and the Components bar in the Monitor Dashboard of Figure 10 represent the state of the seg-a segment and the 7 components that are in the east_coast zone (see Figure 8 and Figure 9).
Let us now proceed to view the current alarms window of user john. Figure 9 depicts the alarm window corresponding to john. Only the alarms pertaining to the site buy.abc.com, which is being monitored by john, appear.
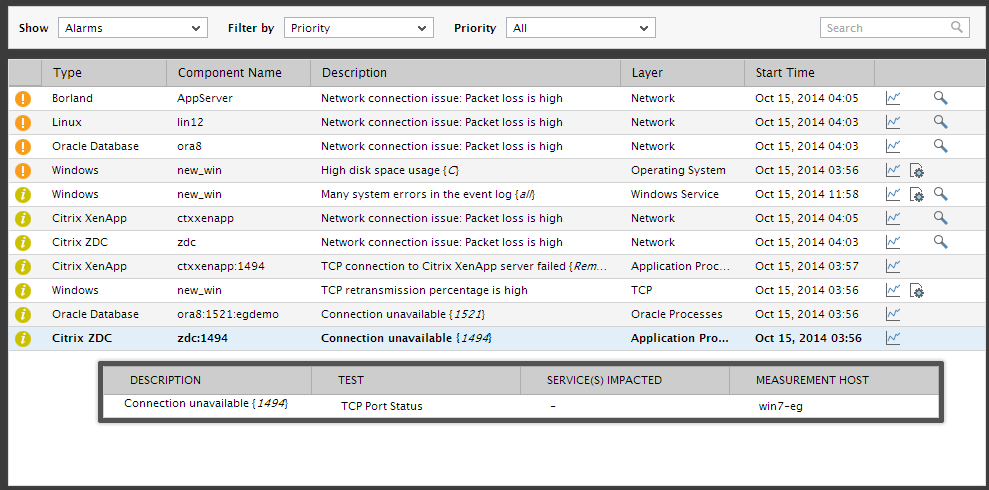
Figure 8 : Alarms specific to user john
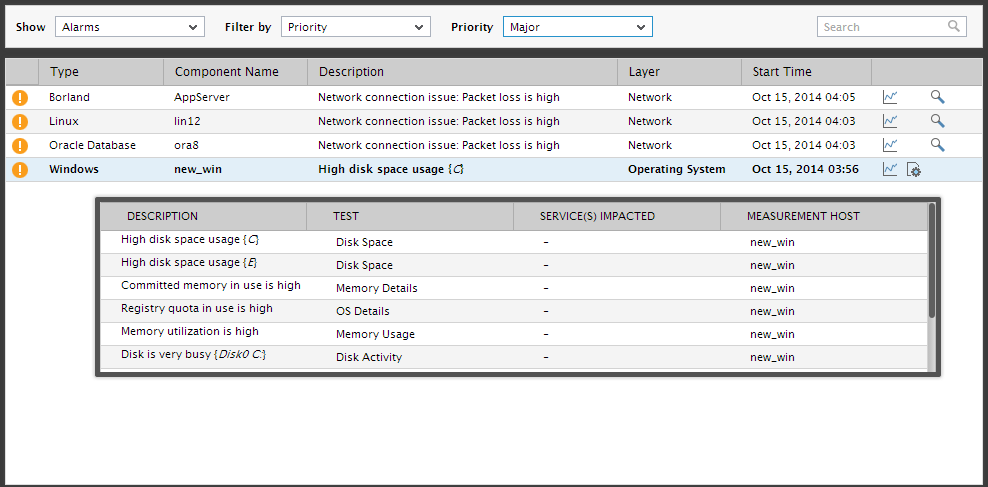
If only ‘critical’ alarms pertaining to the buy.abc.com site assigned to user john had been configured for display in the monitor interface, then the current alarms window will appear as depicted by Figure 9.
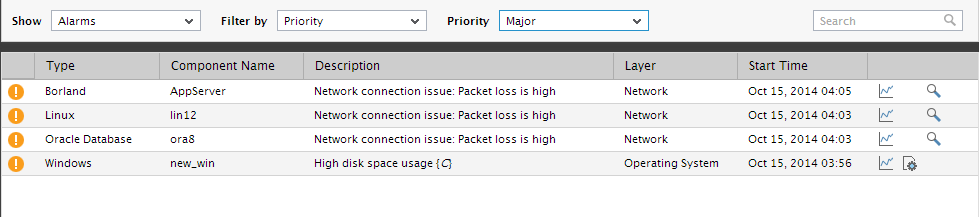
Figure 9 : The Alarms window displaying only the Major alarms of user john
Move your mouse over the first alarm and you will see the details of the alarm as depicted by Figure 10 below. The details include a brief description of the problem and the test that is reporting the problem. Note that the first alarm pertains to a NAS server, the layer that is problematic is the Application Processes layer, the test reporting the problem is Processes test, and the problem is with the kjs process, which is not running.