Systems Tab Page
For every component that is included in the segment, the Systems tab page displays the state of each component and the real-time values of key hardware/network/operating system-level measures that have been pre-configured for the components. With the help of this tab page, you can receive instant intimations of hardware failures, network latencies, and other host-level performance ills that the segment components are experiencing currently.
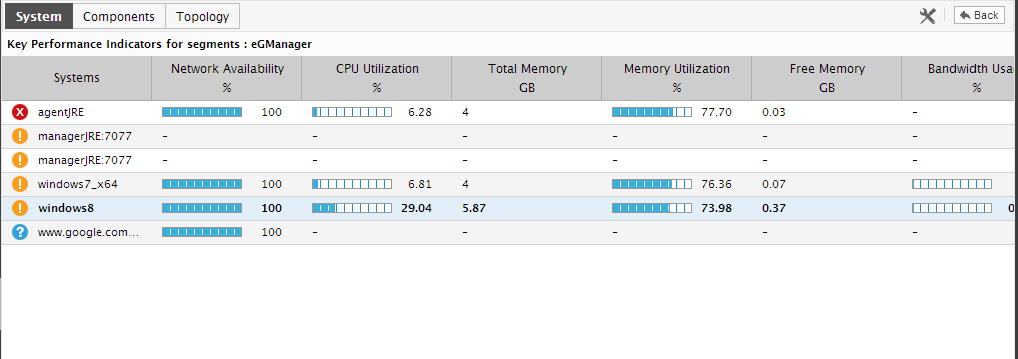
Figure 1 : The Systems tab page of a Segment node that is clicked on in the tree-structure
If required, you can add more measures to this list or delete one/more existing measures. For this, click on the  icon at the right, top corner of Figure 1. Figure 2 will then appear.
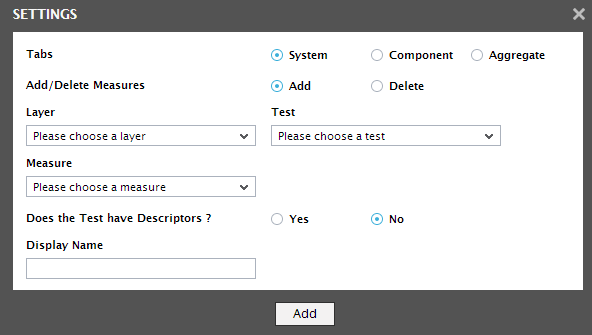
Figure 2 : Adding a measure to the Systems tab page
To add a measure to the Systems tab page using Figure 2, do the following:
- Select the Systems option from the Tabs section.
- Set the Add/Delete Measures flag to Add.
- The Layer list will be populated with all the host-level measures related to all segment components. Pick the Layer that reports the measure of interest to you,
- This will populate the Test list with all the tests that execute on the chosen Layer. Select the Test that reports the measure you need.
- Then, choose the Measure to be added and provide a Display Name for the measure.
- Finally, click the add button to add the chosen measure to the Systems tab page.
To delete a measure from the Systems tab page using Figure 2, do the following:
- Select the System option from the Tabs section.
- Set the Add/Delete Measures flag to Delete.
-
Then, from the Test list of Figure 2, pick the test that reports the measure to be deleted.
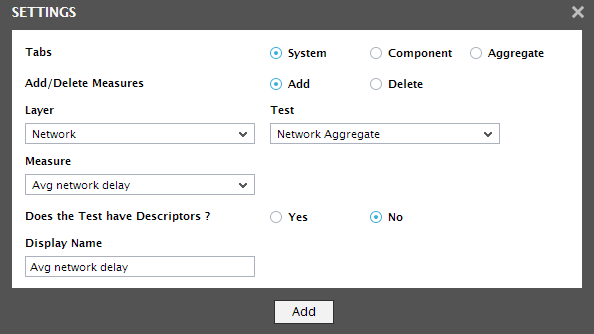
Figure 3 : Deleting a measure from the Systems tab page
- Choose the Measure to be deleted. The Display Name of the selected measure will then be automatically displayed.
- Click the delete button to delete the measure.
By default, the contents of the Systems tab page are sorted based on the state of the segment components listed therein. If more that one component exists in the same state, then the components of that state will be sorted in alphabetical order. If need be, you can change the sort order. For example, if you wish to sort the components listed in the Systems tab page in the descending order of the values of their Disk Usage, just click on the Disk Usage label. Doing so, tags the Disk Usage label with a down arrow icon – this icon indicates that the Systems tab page is currently sorted in the descending order of the total disk space used by each component. To change the sort order to ‘ascending’, all you need to do is just click again on the Disk Usage label or the down arrow icon. Similarly, you can sort the Systems tab page based on any column available in the table.
Click on any segment component in the Systems tab page to view the layer model of that component.
Note:
- Only a user who is assigned the Admin role is allowed to customize the segment dashboard by clicking on the icon.
- While displaying values for descriptor-based measures in the Systems tab page, the eG Enterprise system does not display the actual values per descriptor. Instead, the solution computes the average or the total sum of values across descriptors and displays it in the corresponding measure column. For instance, for values reported as percentages, the solution computes the average value across descriptors. On the other hand, if the value is reported as a GB or MB, then the total sum of all the descriptor values of the component will be displayed against the component.