The Components Tab Page
The Components tab page provides insights into the performance of the applications that are part of the chosen zone. For each application that has been added to a zone, users can configure key application-level metrics that are to be captured in real-time and displayed in the Components tab page. This way, users can ensure that they receive a heads-up on common, yet critical operational issues encountered by an application that is part of a zone, without having to go to the layer model page of that application for this purpose.
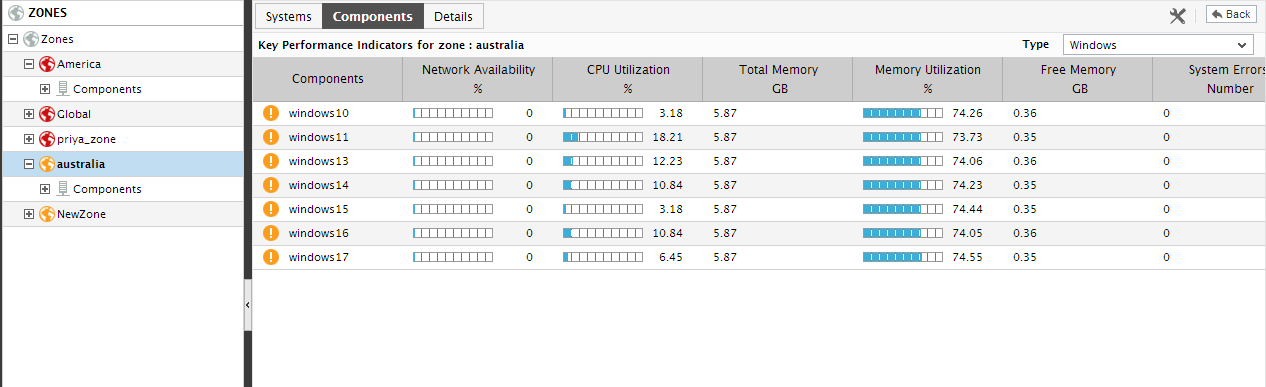
Figure 1 : The Components tab page of the Zone Dashboard
Since metrics are configured per application, the application level metrics displayed in this tab page will differ based on the type of the component. A Type drop-down list as shown in Figure 1 will be populated with all the component types associated with the chosen zone. You can pick the component type of interest to you from the Type drop-down list to view the user-configured application level metrics of all zone components of that type.
Note:
The Type drop down list will be sorted based on the current state of the zone components of each type.
By default, the components listed in the Components tab page will be sorted in the order of their state - starting from the critical to the normal. If more that one component exists in the same state for the chosen component type, then the components of that state will be sorted in alphabetical order. If need be, you can change the sort order based on the application level metrics that are displayed against each component. For example, if you wish to view the sort the Oracle Database server list in the Components tab page in the descending order of the number of Table Space usage, just click on the Table Space usage label. Doing so, tags the Table Space usage label with a down arrow icon – this icon indicates that the Components tab page is currently sorted in the descending order of the table space usage of each zone component of type Oracle Database. To change the sort order to ‘ascending’, all you need to do is just click again on the Table Space usage label or the down arrow icon. Similarly, you can sort the Components tab page based on any column available in the table.
Clicking on a component here will lead you to the layer model page of that component, where the problem layer, test, and measures are revealed.
On the other hand, if no metrics have been configured for the Type chosen, then a message to that effect will appear.
To modify the measure-list associated with a component type, do the following:
-
Click on the
 icon provided near the Back button in Figure 1. In the Settings window that appears (see Figure 1), select Components from the Tabs flag.
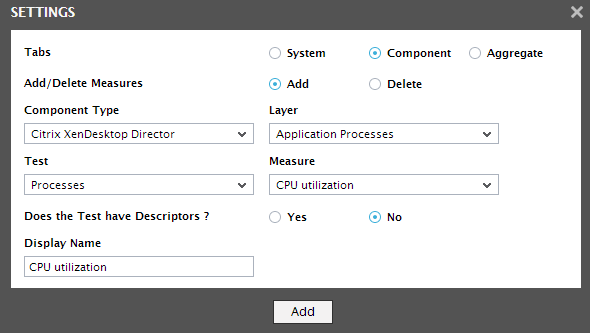
Figure 2 : Selecting the Components flag from the Configuration Settings Window
- To add more metrics to the Components tab page, first, select the Add option from the Add/Delete Measures flag. Then, pick the Component Type to which the addition applies.
- Next, select the layer for which you wish to add the test from the Layer drop down list. Then, select the Test that reports the measure of your choice, pick the measure of interest from the Measures list, provide a Display name for the measure, and click the Add button to add the chosen measure to the Components tab page.
- If you want to delete one/more measures from this section, then, as soon as you choose the Delete option from the Add/Delete Measures flag, the Test drop down list will be populated with all the existing tests for which measures are displayed. Pick a test and choose a Measure of your interest to delete from the Components tab page.
Note:
- Only a user who is assigned the Admin role is allowed to customize the zone dashboard by clicking on the icon.
- While displaying values for descriptor-based measures in the Components tab page, the eG Enterprise system does not display the actual values per descriptor. Instead, the solution computes the average or the total sum of values across descriptors and displays it in the corresponding measure column. For instance, for values reported as percentages, the solution computes the average value across descriptors. On the other hand, if the value is reported as a GB or MB, then the total sum of all the descriptor values of the component will be displayed against the component.