The Details Tab Page
The Details tab page, when clicked, provides a quick overview of the performance of a chosen zone.
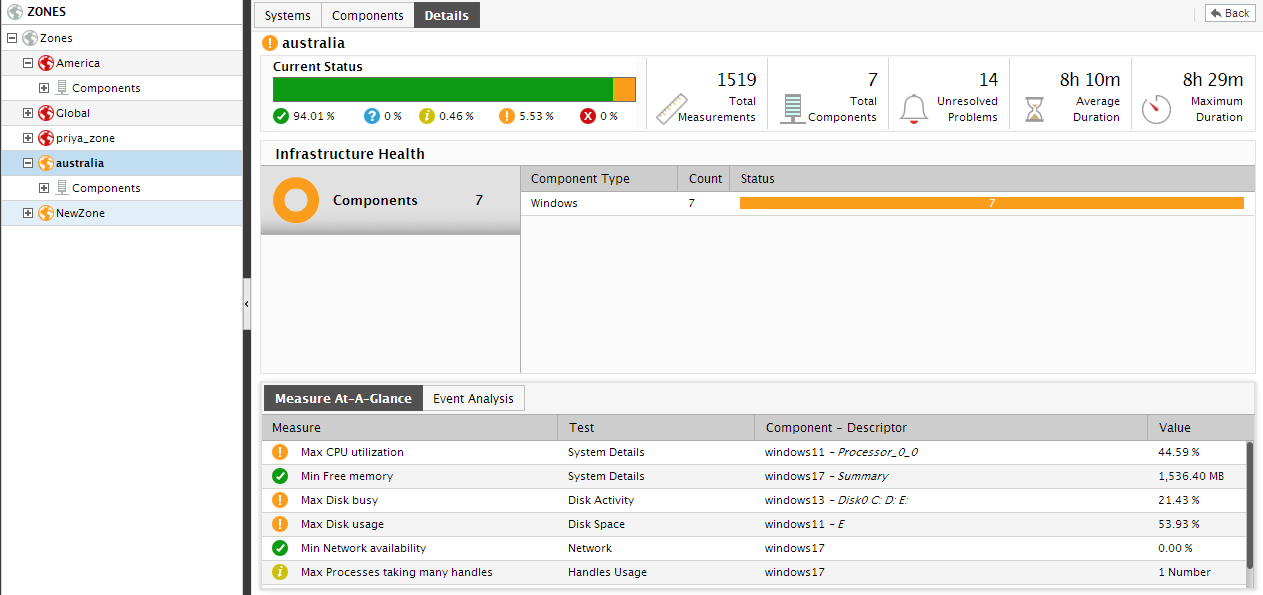
Just like the Monitor Dashboard, the Details tab page too comprises of four panels, each of which sheds light on a critical performance aspect of the chosen zone. The Current Status panel displays the total number of measurements that eG Enterprise has collected from the zone elements, and also indicates the percentage of measurements that are in abnormal, unknown, and normal states. A count of currently unresolved issues at the zone-level is also available here. This panel thus provides an overview of the health of the zone. Clicking on any of the states here will take you to the Current Alarms window, where you can view all open alarms of the corresponding priority.
A zone can contain a wide variety of infrastructure elements starting with independent components to segments, services, and even other zones. The Infrastructure Health section of Figure 1 therefore, graphically represents the different categories of infrastructure elements that a zone contains, and how well each category is currently performing. The Sub Zones bar graph for instance indicates the number of zones that have been added to the zone being monitored, and the current state of these subzones. You can zoom into individual subzone performance, by clicking on a division in the bar graph; the subzones which are in that particular state will then appear.
Clicking on the Sub Zones link in the Infrastructure Health section also invokes the zone list page, but in this case, the page displays all sub-zones that are part of the parent zone, regardless of state.
Either way, by default, the zone list page that appears displays the following sub-zones: direct sub-zones of the original zone, and zones (if any) that are included in the direct sub-zones. For instance, assume that 3 zones - zone A, zone B, and zone C - have been configured. While zone B has been directly assigned to zone A, zone C has been added to zone B. Now, while viewing the dashboard of zone A, if say, the Sub Zones link in the Infrastructure Health section is clicked, then the resulting zone list page will list the following by default:
- zone B which is the direct sub-zone of zone A;
- zone C which is added to zone B
In the same way, the Components bar graph represents the number and state of the components that are part of the zone. Clicking on a division in the Components bar lists the components in that particular state. Instead, if you click on the Components label in the Infrastructure Health section, you can view the complete list of components associated with the chosen zone, regardless of state.
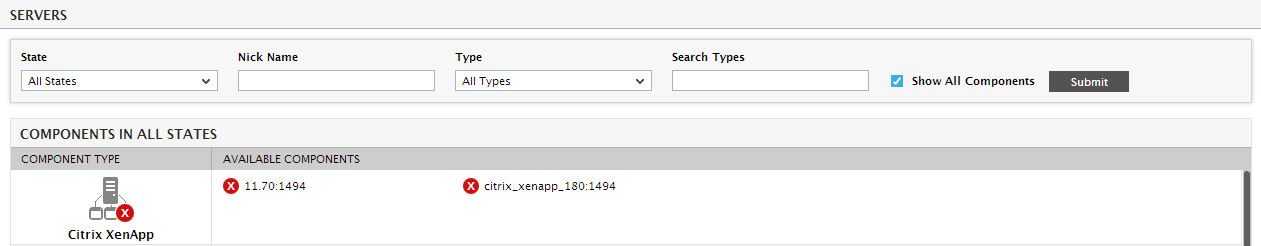
Figure 2 : A page displaying the zone components in a CRITICAL state
Likewise, the Services and Segments bars in the Infrastructure Health section indicate the number and state of services and segments (if any) that are part of the said zone. While clicking on any division in the Services graph provides you with a list of services in that particular state, segments of a specific state will be displayed when you click on the corresponding division in the Segments graph. Alternatively, you can click on the Services or Segments label (as the case may be) to view all the segments/services (as the case may be) included in the zone, regardless of their state.
If the Measures At-A-Glance section is enabled by Clicking on the  icon available in the Admin tab. Then, select the Monitor option in the Settings tile in the eG administrative interface, and if measures have been configured to be displayed in this section, then the Details tab page will display a Measures At-A-Glance section. The Measures At-A-Glance section (not shown in Figure 2) provides the min/max values of critical performance data collected in real-time from the zone being monitored. A quick look at this panel will instantly reveal significant deviations in zone performance. Click on any of the measures in this section to view the layer model, tests, and measurements pertaining to the corresponding component.
Alongside the Measures At-A-Glance tab is an Event Analysis tab, that primarily lists the top-5 layers at the zone-level, which were most affected by performance issues. Corresponding to every layer name in this section (see Figure 2), you will see the number of alarms that are currently open for that layer, the average duration of the open alarms, and the maximum duration for which an alarm had remained open. If you have a dedicated troubleshooting cell for the zone, then this information will serve as an effective indicator of the efficiency of the cell in resolving performance issues pertaining to the zone. To view the complete history of alarms in the environment, click on the Click here for more events >> link.
Besides a layer-wise event analysis, this section also enables a component-wise review of events that occurred during the last hour (by default). By choosing a different duration from the Components with most events in the last list, you can view the zone components that experienced performance degradations during the chosen duration, and the number of problem events each such component encountered. This sheds light on the most problem-prone components in the zone. Clicking on a component or component-type in this section, will lead you to the layer model of the corresponding component, revealing the current status of the component layers.
The Components At-a-Glance section comprises of a bar graph depicting the number of components of each type that available in the monitored zone, and their respective states. Clicking on a bar will take you to a page that lists the individual components of the corresponding type and state. To view the complete list of zone components of a particular type, just click on the corresponding component-type in the Components At-A-Glance section.
Note:
By default, in the Components At-A-Glance section, the component-types are sorted in the descending order of the total number of monitored components of every type - in other words, in the descending order of the values in the Count column of the section. To change the sort order - i.e., to sort the component-types in the ascending order of the contents of the Count column - simply click on the down-arrow icon next to Count. To sort by a different column, say, the Server Type column, simply click on the corresponding column heading. This will instantly sort the contents in the alphabetical order of the names of the displayed server types. You can even override the default sort order, so that the component-types are by default arranged in the alphabetical order of their names, and not on the basis of the Count. To achieve this, first switch to the eG administrative interface, and then Click on the icon available in the Admin tab. Then, select the Monitor option in the Settings tile. In the OTHER DISPLAY SETTINGS section of the MONITOR SETTINGS page, set the Sort components in dashboards flag to By component types. This ensures that the contents of the Components At-a-Glance section are by default sorted in the ascending order of the component-types. Accordingly, the down-arrow icon, by default, appears next to the column heading, Server Type.