The Layers Tab Page
Each component managed in eG Enterprise – be it a server, system, or a network device – is represented as a set of hierarchical layers. Each of these models determines what metrics to collect for each application or network device, how to collect these metrics, how to analyze the collected metrics, and what to deduce from the analysis. Since each infrastructure component performs different functions, the layer model for the different applications and network devices are different.
Typically, to view the layer model of a component, you need to click on that component in the COMPONENTS page. This will lead you to the Layers tab page, where the layer model of that component will be displayed. In Figure 1 for instance, you will find that the Layers tab page displays the layer model of a Citrix XenApp component.
By default, the Type list lists the name of the component type and the Name list displays the component for which the layer model is to be viewed. If multiple components of a single component type are monitored, then, to search for the component of your interest, you are allowed to type a first few alphabets from the name of the component in the Name list. The result set then displays the component names of your choice from which you can pick the exact component.
If the chosen component belongs to a service, then clicking on the  icon leads you to the exact service to which the component belongs. If the component is part of a virtual topolgy, then, clicking on the
  icon leads you to the COMPONENT TOPOLOGY page.
Each layer of a layer model (also called as monitoring model) is mapped to tests that measure the health of that layer. Clicking on the > button alongside a layer name will reveal the tests associated with that layer. For instance, in Figure 1, clicking on the > button against the layer name Windows Service, will reveal the tests mapped to that layer. Clicking on a test will list the measures reported by that test in the panel to the right.
The state of a layer is determined by the state of the tests that are associated with it and the state of the measures that the tests report. For example, the Windows Service layer of Figure 1 is in the Minor state presently.
From the tests list for the Windows Service layer, it is evident that a Minor problem captured by the Security Log test of that layer is responsible for the abnormal state of the layer. Clicking on the Security Log test in Figure 1 will reveal the measures reported by that test. The measures clearly indicate that audit failures are the reason for the Minor problem with the Windows Service layer. Since layer state impacts the component state, the Citrix XenApp component too is in a Minor state currently.
But, what happens if different layers of a model are in different states? In this case, the component assumes the state of that layer with the most critical problem. For instance, take the case of the Citrix XenApp component in Figure 1. As you can see, the Citrix Applications layer of the component is in a Major state and the Citrix Users layer of that component is in the Minor state currently. In other words, a Major problem has been captured in the Citrix Applications layer, and a Minor problem has been detected in the Citrix Users layer. In this case, since the more critical of the two problems is the Major problem, the state of the Citrix XenApp component also becomes Major.
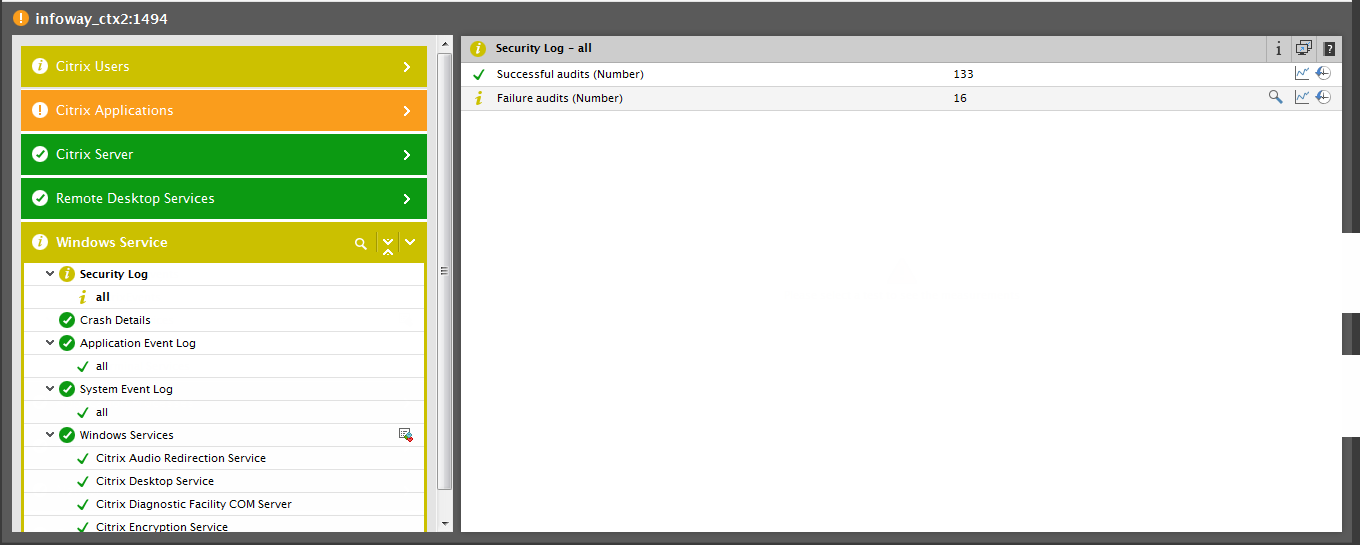
Figure 1 : State of a component if the layers are in different states
Each pre-defined layer model has been built bottom-up, with the system and network tiers at the bottom and the application tiers at the top. Typically, a problem at the host or network-level – eg., a CPU/memory contention on the host, loss of network connection to the host, etc. – can impact the health of the application layers at the top . eG understands these layer-layer dependencies; this is why, whenever a component encounters more than one issue at the same time, eG automatically correlates issues across the layers of a layer model using a patented top-down correlation algorithm, and intelligently determines the state of the layers. For instance, take the case of the Citrix XenApp component, the layer model of which is depicted by Figure 1. As you can see, the Citrix Applications layer is in a Major state, while the Citrix Users layer is in a Minor state. To know what is the Major problem that is impacting the health of the Citrix Applications layer, click the > button alongside the layer name in Figure 1. Figure 2 then appears, revealing that the Citrix XA Applications test has captured a Major problem with the Java GUI application. To know what the problem is, click on Java GUI in Figure 2. Doing so reveals that the Java GUI application is consuming over 30% of the CPU of the XenApp server.
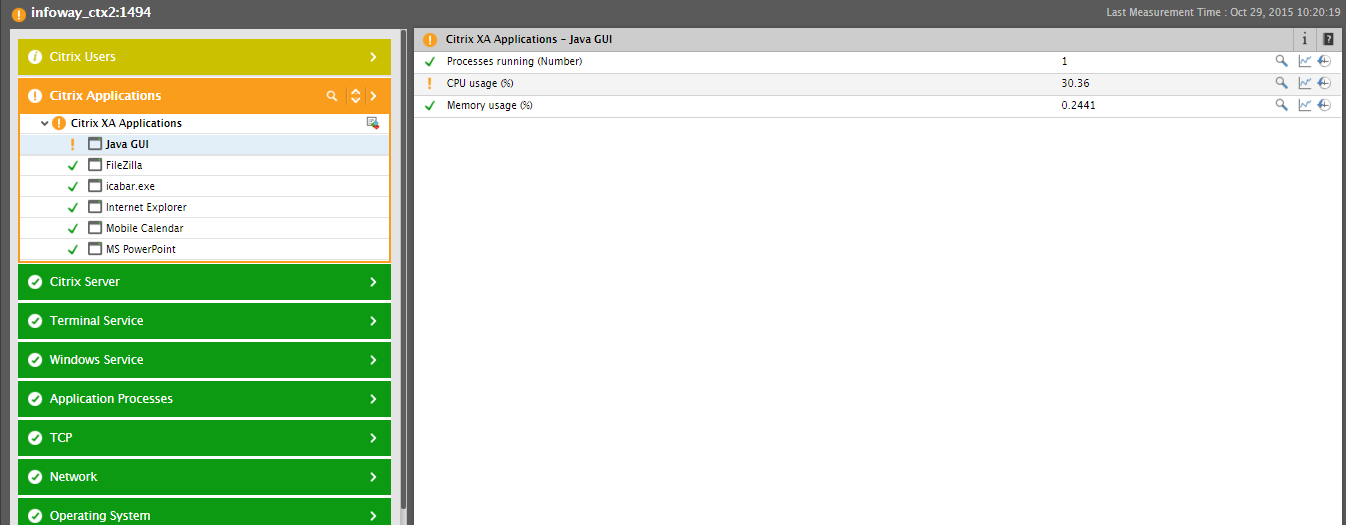
Figure 2 : Measures reported by the Citrix XA Applications test
To know when this problem occurred, you can instantly invoke the eG alarm that corresponds to this issue from the Layers tab page itself. For that, just click on the problematic CPU usage measure. Figure 3 will appear providing the details of the alarm, along with its start time.
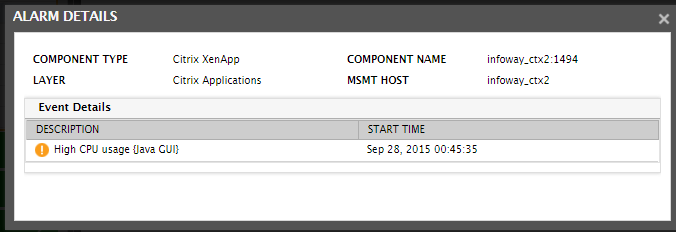
Figure 3 : Alarm details viewed from the Layers tab page
Excessive CPU usage by an application on XenApp is bound to adversely impact the experience of the users of that application. Is that the reason why the Citrix Users layer, which reports user experience issues, is also in an abnormal state? Let’s find out. For that, click on the > button alongside Citrix Users in Figure 2.
When Figure 4 appears, you can find that the Citrix User Experience test is reporting a Minor issue with experience of user kevin. Clicking on kevin reveals that kevin’s experience with the XenApp server is very poor, causing a Minor alarm to be raised.
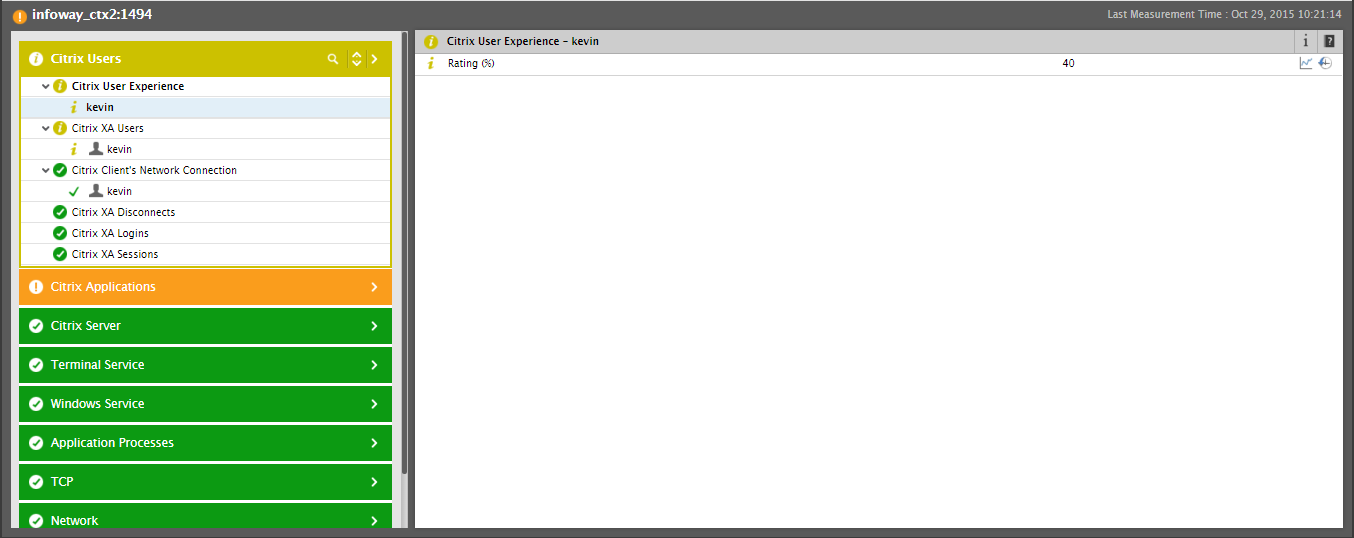
Figure 4 : Measures reported by the Citrix User Experience test
To know the root-cause of this poor experience, click the kevin descriptor of the Citrix XA Users test. Figure 5 that appears indicates that one/more applications accessed by user kevin are consuming over 30% of CPU. This proves beyond doubt that the excessive CPU consumption by the Java GUI application has badly affected user kevin’s experience with the XenApp server. eG’s intelligent correlation engine has automatically correlated the Java GUI application’s high CPU usage issue with user kevin’s user experience issue and has accurately figured out that the CPU usage issue captured by the Citrix Applications layer is the root-cause of the user experience issue reported by the Citrix Users layer. Accordingly, eG has automatically assigned the Major state to the problem source – i.e., the Citrix Applications layer - and has bumped down the state of the problem effect – i.e., Citrix Users layer.
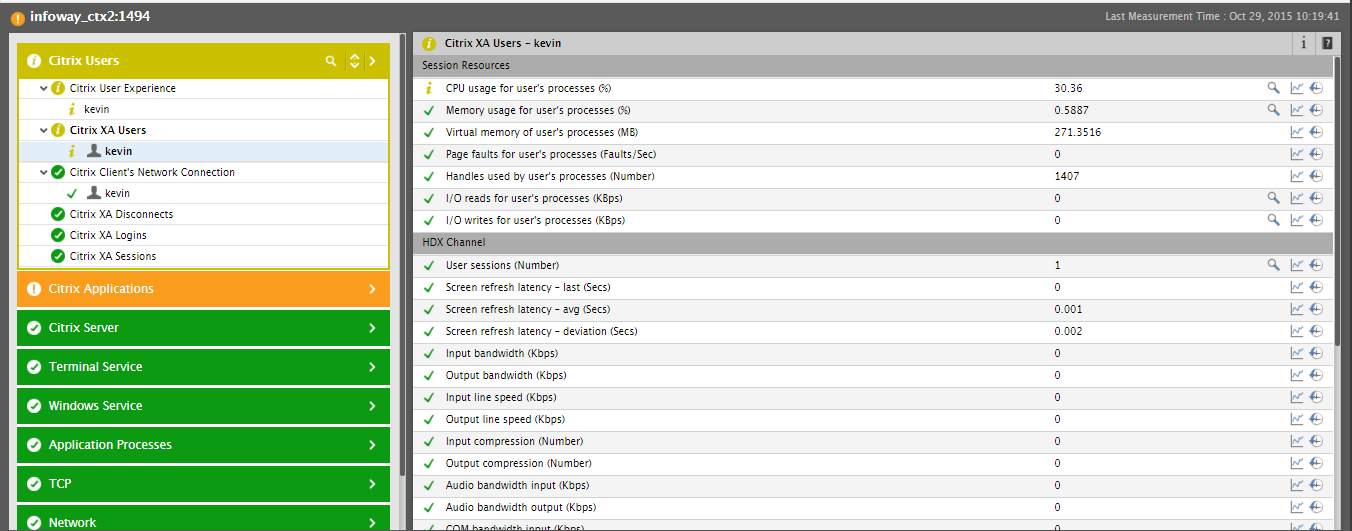
Figure 5 : Measures reported by the Citrix XA Users test
By default, all the components managed in the infrastructure will be listed in the Component list box as shown in Figure 6. If too many components are managed in the target environment, then users may find it difficult to scroll down to the component of their choice from this list. A search capability is provided in this list box wherein users can key in a few alphabets from the component of their choice to filter out the results.
eG’s layer model representation does more than just report what the problem is; it also enables administrators to figure out “how long the problem had persisted”. For this, eG Enterprise allows you to launch a time-of-day graph of the problematic measure from the Layers tab page itself! To demonstrate this capability, let us take the example of Figure 6, which depicts the layer model of a Citrix XenApp server. As you can see, the Security Log test mapped to the Windows Service layer of this server has captured multiple security audit failures on the server.
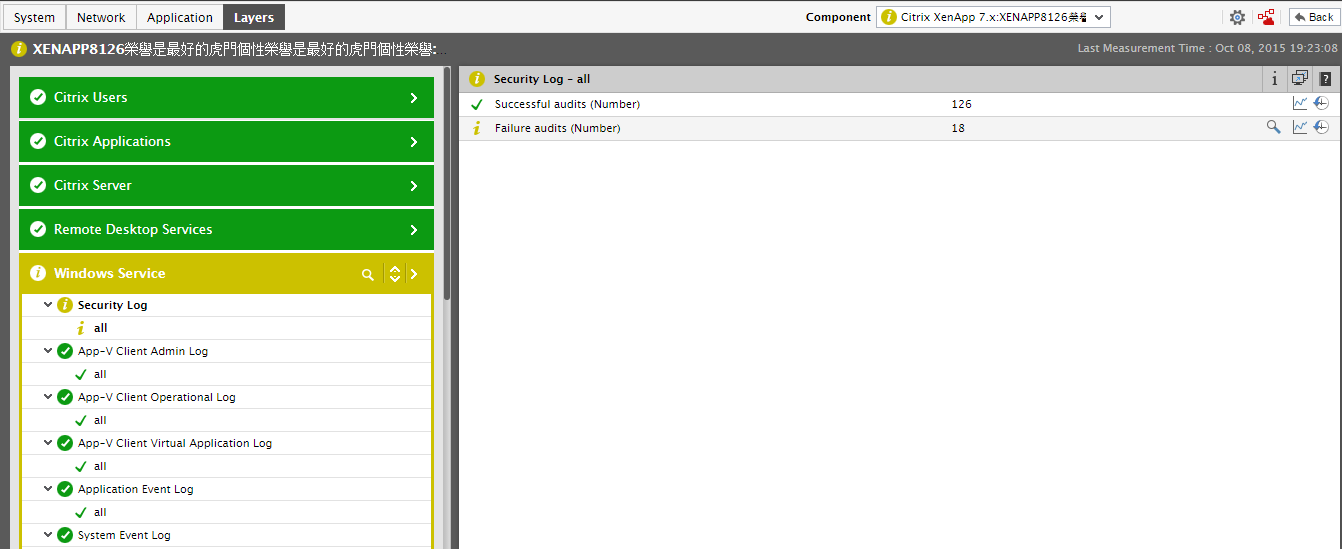
Figure 6 : The Security Log test reporting multiple security audit failures on a Citrix XenApp server
To view the historical graph of the Failure audits measures in
Figure 6, click the  (graph) icon alongside that measure name. This will instantly provide you with a measure graph (see Figure 7) revealing variations in the count of audit failures during the last hour (by default).
Note:
By default, clicking on the graph image against a measure reveals a graph that plots the values registered by that measure during the last hour. This default duration however is configurable. To override the setting, indicate a different duration in the Timeline for graphs setting in the monitor settings page, which appears when clicking on the  icon available in the Admin tab and then, selecting the Monitor option in the Settings tile in the eG administrative interface.
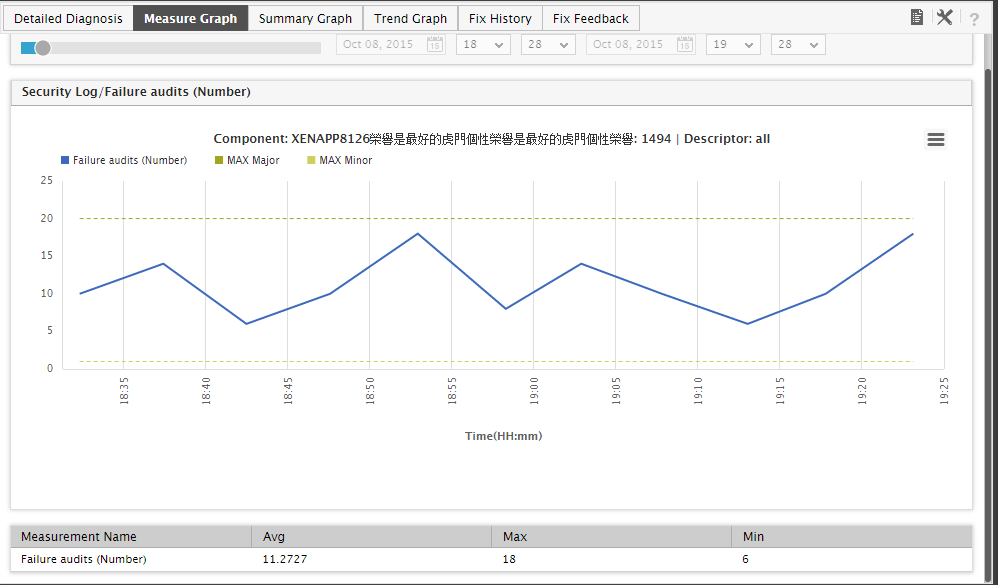
Figure 7 : A measure graph indicating the number of audit failures that occurred in the last hour
The graph clearly reveals that the Failure audits measure violated its MAX Minor threshold throughout the last 1 hour. This could also mean that the Minor issue that occurred owing to this threshold violation has persisted for an hour or even more! The question now is how to resolve this issue? For that, you will first have to figure out why the issue occurred. This is where, the Detailed Diagnosis capability of eG Enterprise comes in handy! This capability, if enabled for a test, provides detailed metrics that will take you a step closer to identifying why a problem occurred. Take the case of the Citrix XenApp component of Figure 6 again. As already mentioned, audit failures have been detected on the XenApp component. To know when and why these failures occurred, you can use the Detailed Diagnostics provided by the Security Log test. To access these additional diagnostics, you need to click on the ‘magnifying glass’ ( ) icon alongside Failure audits in Figure 6. This will open Figure 8, where the complete description of the failure events will be revealed.
Note:
By default, clicking on the  icon against a measure reveals the detailed diagnosis of that measure during the last hour. This default duration however is configurable. To override the setting, do the following:
- Edit the eg_ui.ini file (in the <EG_INSTALL_DIR>\manager\config directory)
- By default, the dd_display parameter in the [graphs] section of the file will display the value 1, indicating that the default detailed diagnosis duration is 1 hour. This value can be changed, if need be.
- After making the necessary changes, save the eg_ui.ini file.
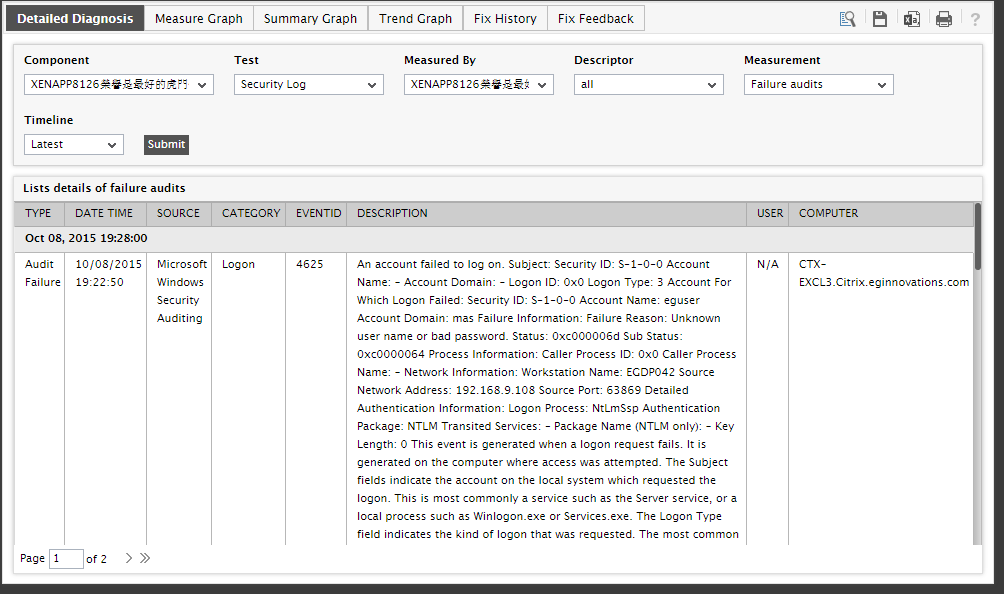
Figure 8 : The detailed diagnosis of the Failure audits measure
From Figure 8, it is evident that one of the reasons why a security audit failed on the XenApp server was a login failure experienced by a user on that server. To resolve this issue, you need to figure out which user’s login failed and why the failure occurred. The Detailed Diagnosis page (see Figure 8) provides this information as well! From the user column of Figure 8, you can identify the user who experienced the login failure. Armed with the root-cause of the problem, you can quickly resolve the issue!
Sometimes, a configuration change effected in a component could be the root-cause of a performance issue with that component. Take the case of the Oracle database server, the layer model of which is depicted by Figure 9. As you can see, a Critical issue has been detected in the Tablespaces layer of this server – apparently, the USERs tablespace has run out of space!
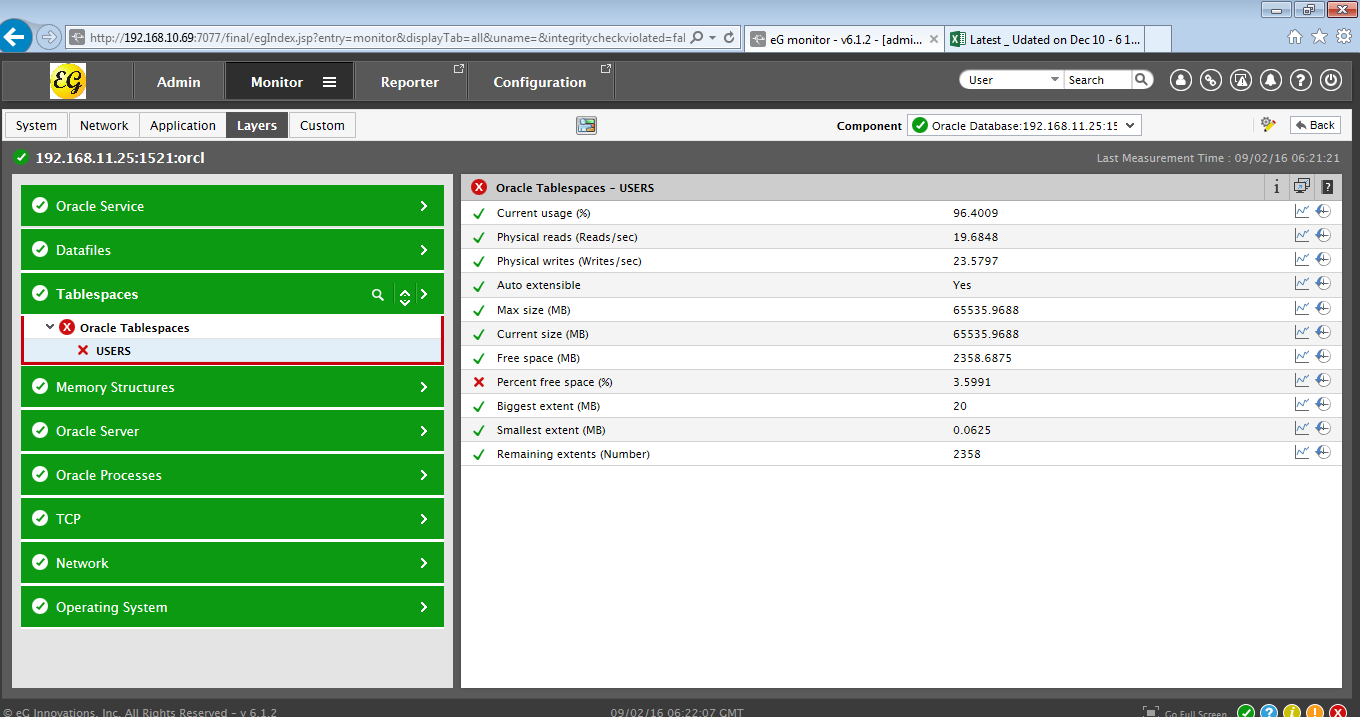
Figure 9 : A Critical issue with the ORDERS tablespace of an Oracle database server
What could have caused this space drain? The presence of the  icon at the right, top corner of the Layers tab page (see Figure 9) indicates that a configuration change has been made to the Oracle database server at around the same time as the tablespace issue. Could this change have contributed to the problem at hand? eG enables you to answer this question by allowing you to instantly determine what configuration change was made and confirm whether/not that change impacted free space availability on the tablespace. For this, just click on the icon. A pop up window (see Figure 10) will appear listing the recent configuration changes in a brief manner.
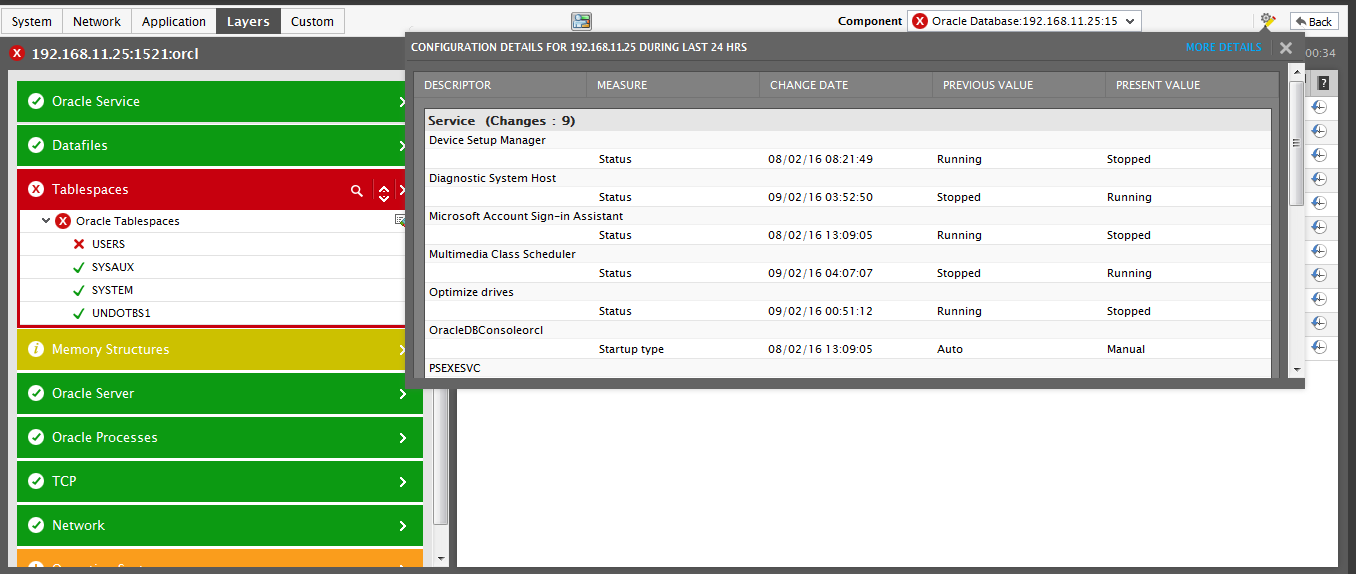
Figure 10 : The pop up window revealing the recent configuration changes
Clicking the More Details in Figure 10 will lead you straight into the Configuration Management console, where you can view the configuration change made recently on the Oracle database server in question (see Figure 11).
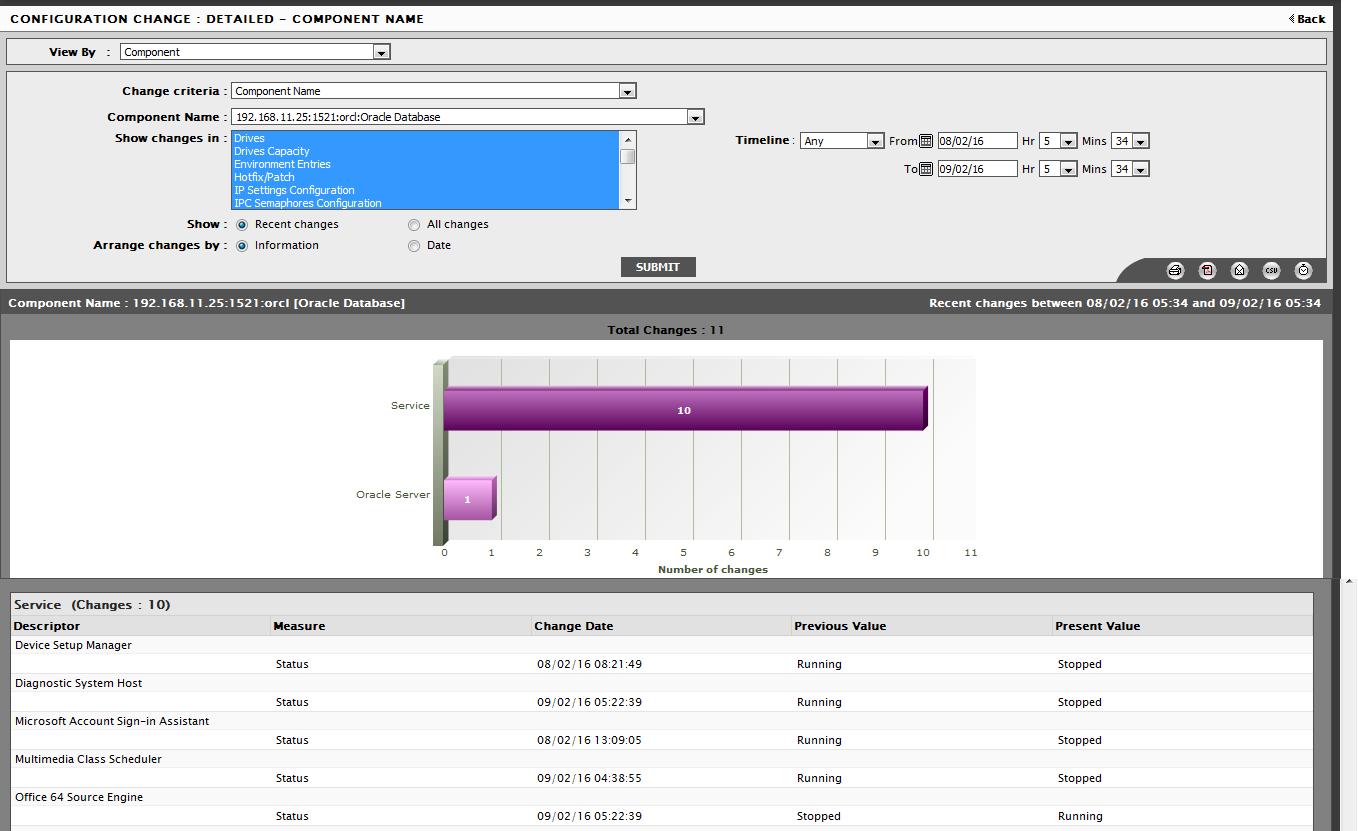
Figure 11 : The configuration change that was made to the Oracle database server
Figure 11 clearly indicates that the Device Setup Manager and Optimize drives service was stopped. In addition, the size of the USERS tablespace has been reduced from 5000000 KB to 200000 KB. Because of this change, the USERS tablespace may not have had enough space to store data, thus resulting in a Critical issue in the Tablespaces layer. This way, using a quick sequence of mouse clicks, you have deduced what really caused a Critical performance issue to occur on a mission-critical server in your environment. We can thus conclude that using just the Layers tab page, you can promptly detect problems with a component, accurately pinpoint their root-cause, and in the process, quickly and easily resolve the problems.
But that’s not all! Using eG Enterprise, you can also create and maintain a knowledge base of problem fixes. This way, the next time any of your colleagues encounter a similar issue, they can quickly query this knowledge base and easily figure out what remedial action should be taken. For instance, let us once again take the case of the problem – i.e., the security audit failure - illustrated by Figure 6. To create a record detailing how this problem is to be fixed, click the Fix Feedback tab page in Figure 12. Here, provide the Problem Reason, describe the Problem Fix, and click Save to save the details provided.
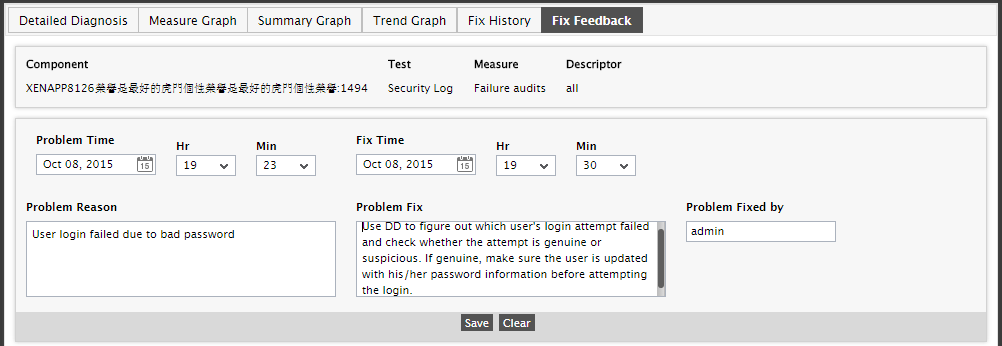
Figure 12 : Recording the fix for a problem
Later, if the same problem reoccurs on the same server or any other server, all you need to do is click the  (history) icon that corresponds to the Failure audits measure in Figure 6. Figure 13 that then appears will display the complete history of all the fixes that have been recorded for the same problem on all components on which the problem was encountered earlier.
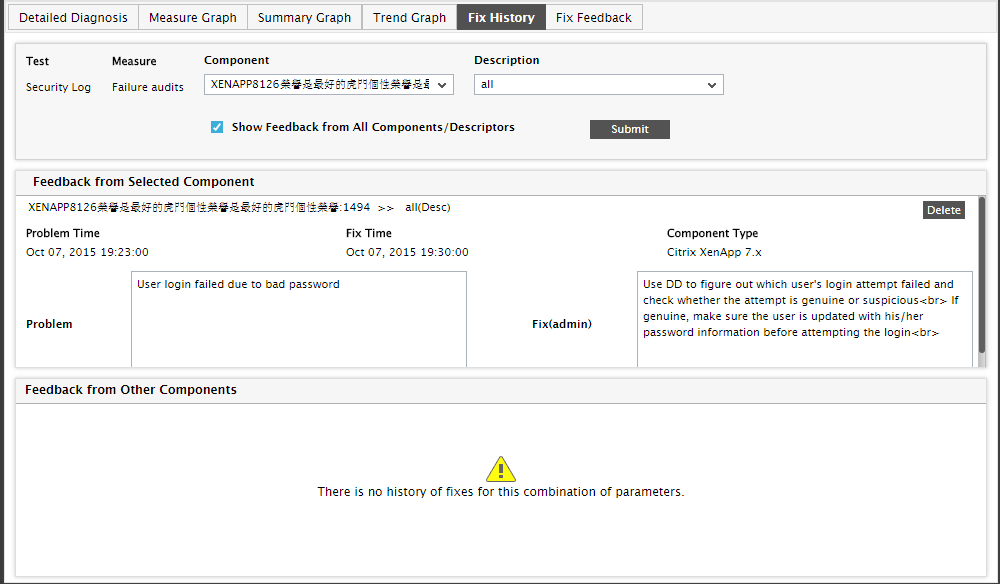
Figure 13 : History of problem fixes
Note:
By default, monitor users have access to the fix history of problems pertaining to only those components that have been assigned to them. To grant the monitor users access to the fix history of all the monitored components in the environment, do the following:
- Edit the [fix_history] section of the eg_ui.ini file in the <EG_INSTALL_DIR>\manager\config directory.
The all_components parameter in this section is set to false, by default. This indicates that, by default, monitor users are provided access to only those monitored components that have been associated with them, and not all the components.
By setting this parameter to true (as shown below), you can ensure that the fix history of all monitored components is available to the monitor users.
[FIX_HISTORY]
ALL_COMPONENTS=TRUE
This Knowledge Management feature of eG Enterprise greatly saves troubleshooting time and related costs.
As can be inferred from Figure 6, the Security Log test in our example reports metrics for only one descriptor, which is all. Some other tests however may report metrics for multiple descriptors. For example – the Oracle Tablespaces test reports usage metrics for each tablespace on an Oracle database server (see Figure 9). For such multi-descriptor tests, the Layers tab page provides you with the option to quickly compare performance across descriptors. For instance, in the case of the Oracle Tablespaces test in Figure 9, you can launch a quick comparison of the space usage in all the tablespaces listed as the descriptors of the test in the Layers tab page, and thus rapidly identify the the exact tablespace that is running out of space.
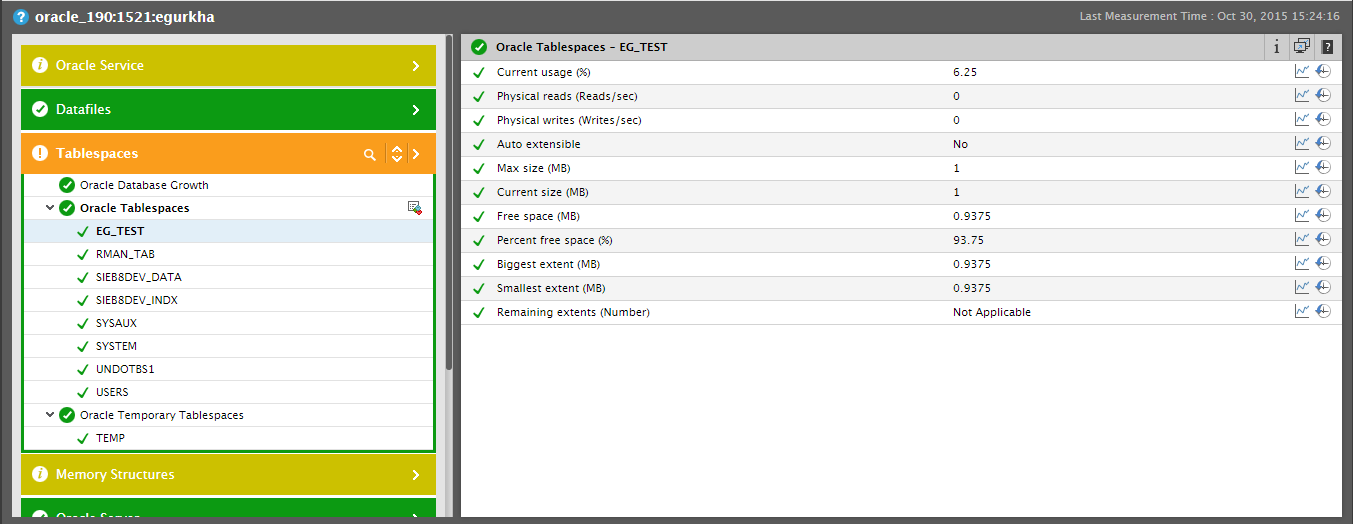
Figure 14 : The Oracle Tablespaces test reporting metrics for every tablespace
To launch this comparison, click the  (Comparison) icon alongside the test name in Figure 14. This will open Figure 15. From the measure names to display list, select the measures to be compared. Then, click the Submit button in Figure 15.
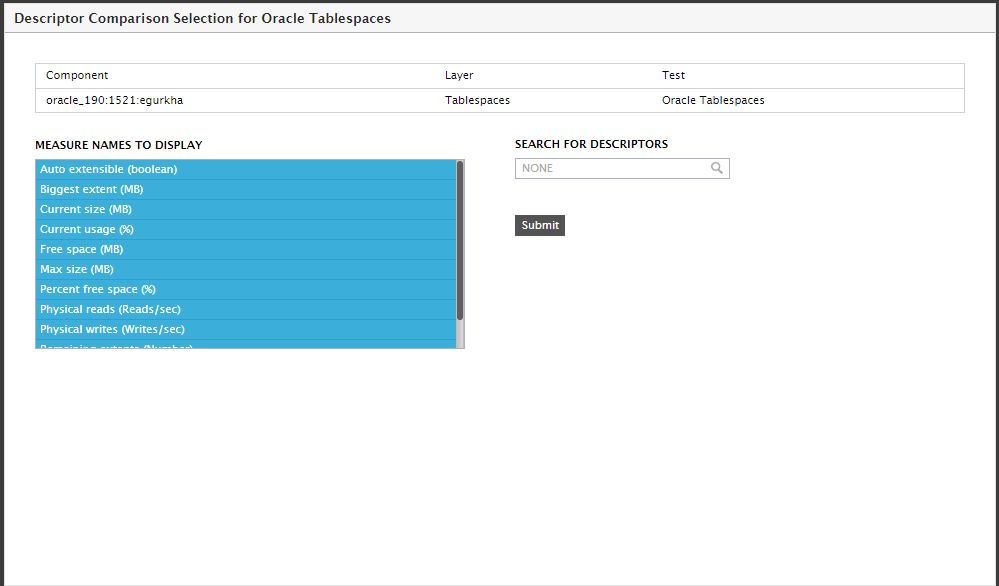
Figure 15 : Selecting the measures to be compared
Doing so will invoke Figure 16, where the chosen metrics will be compared across all the descriptors – i.e., tablespaces, in the case of our example. Using this comparison, you can precisely pinpoint the tablespace that is being over-utilized.
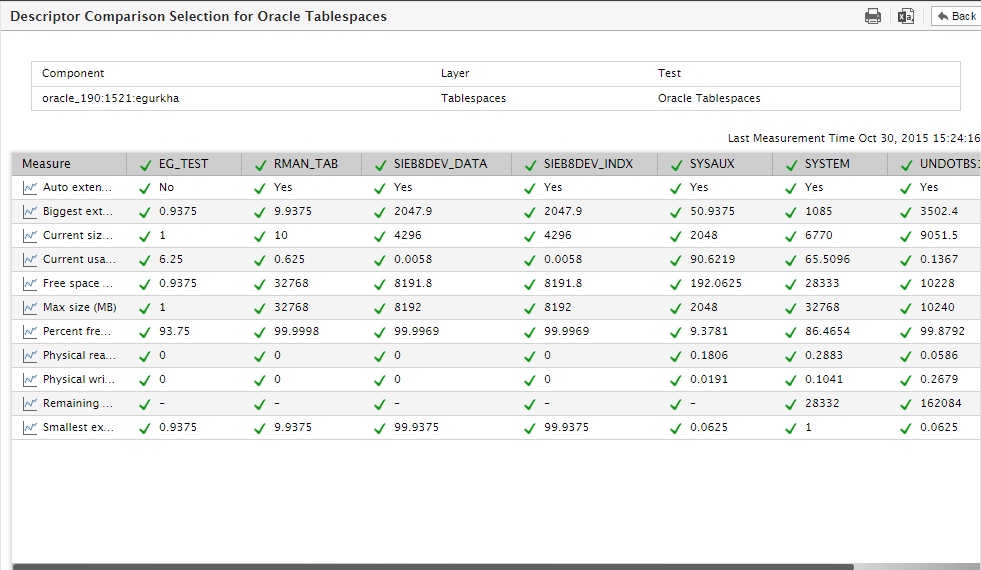
Figure 16 : A comparison of the performance results of all descriptors of the Oracle Tablespaces test
If required, you can even compare the performance of specific descriptors alone. For instance, you can compare the value of only those tablespaces that start with SYS. For this, simply specify SYS in the search for descriptors text box (as shown by Figure 17), and click the Submit button.
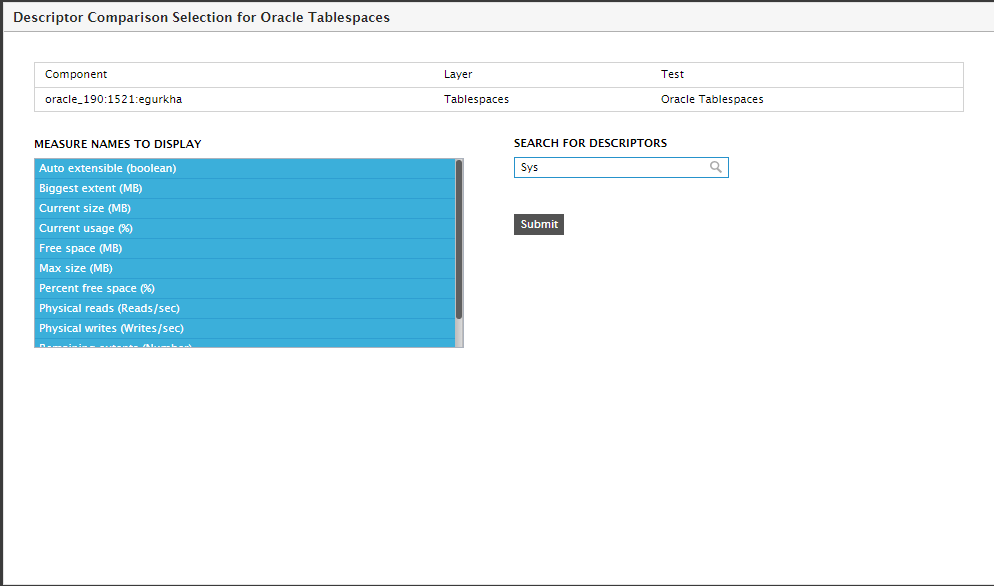
Figure 17 : Comparing across specific descriptors
Figure 18 will then appear, comparing the usage metrics of those descriptors that start with SYS.
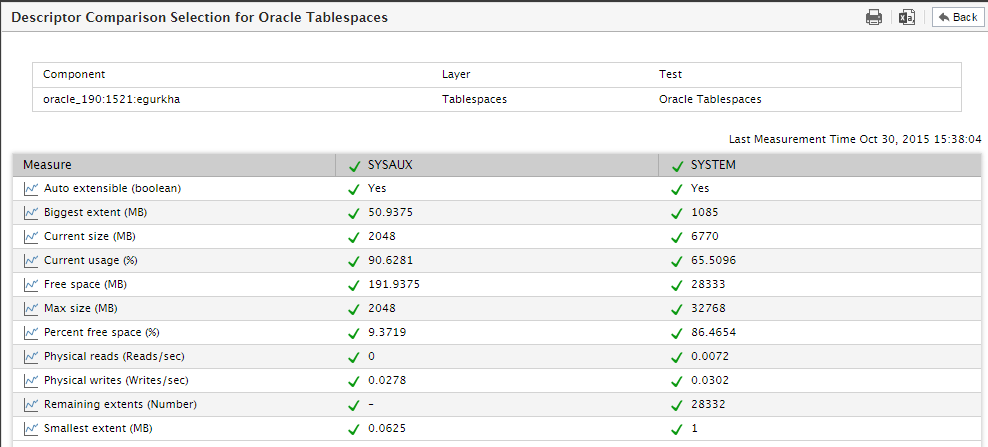
Figure 18 : A comparison of the usage of all Oracle tablespaces that start with the string SYS
At any given point in time, you can even view a comparison graph of any of the measures chosen for comparison, by clicking the icon alongside the measure name in Figure 18. By default, this graph will be generated for a 1 hour timeline for the top-10 descriptors. For instance, the graph in Figure 19 compares the variations in the Current usage of the top-10 Oracle tablespaces, during the last 1 hour. If required, you can pick a different Top-N option from the drop-down in Figure 19 and even select a different Timeline for the graph.
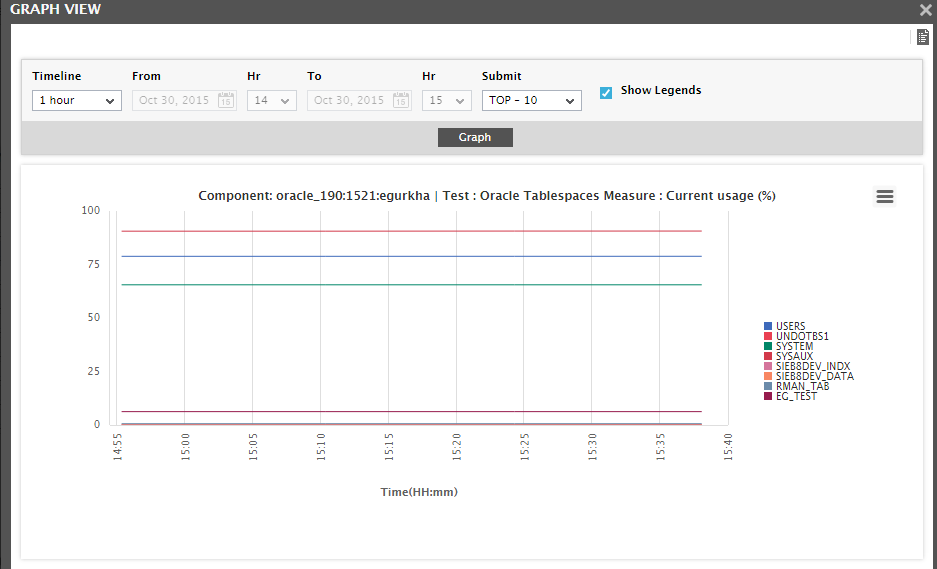
Figure 19 : A graph comparing the value of a particular measure across descriptors
Let’s now go back to the Security Log test example. By default, this test displays the details of all security audit failures that occurred, as part of detailed diagnostics. Sometimes, you may want to focus only on those failure events that occurred recently, and not all of them. To ensure this, you will have to reconfigure the Security Log test. Typically, to make changes to the configuration of any test, you will have to login to the eG administrative interface, open the test configuration page, select the test to be modified, and then make the changes. To save the time and labor involved in this exercise, eG allows you to launch the test configuration page of a specific test and make necessary changes to it, from the eG monitoring console itself! For example, to reconfigure the Security Log test so that the 10 most recent failure events are alone listed as part of detailed diagnostics, first, click the  (Info) icon against the test name in Figure 6.8. Doing so will open Figure 20, where additional details about the Security Log test are displayed. These details include where the test is being executed (i.e., the Measurement Host), how frequently the test executes (Test frequency), when the test was executed last (Time since last measure), and how the test is being executed – i.e., whether internally or remotely (Test type).
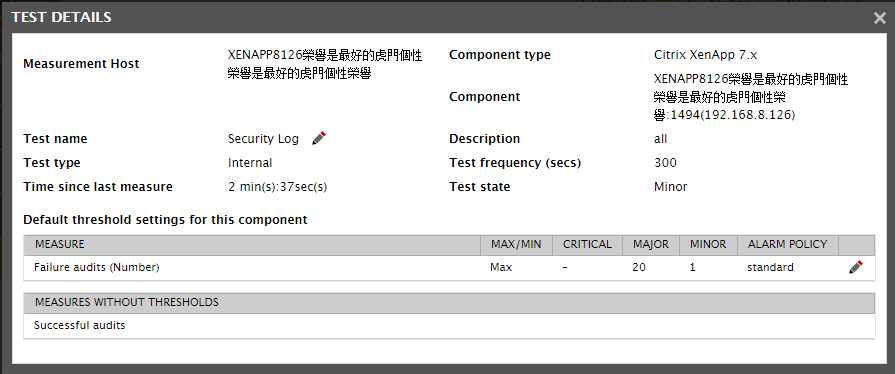
Figure 20 : Viewing the details of a test
Note:
As you can see, the test details page of Figure 20 displays the IP address:port of the problem Component. If the problem component had been managed using its host/nick name, then the Component field in Figure 20 will display the host/nick name:port of the component. The IP that maps to the displayed host/nick name will appear adjacent to it, within brackets. For example, if the Component 192.168.10.28:10818 had been managed using the nick name Nasserver, then the Component field the test details page will display the value:Nasserver:10818 (192.168.10.28).
Additionally, the test details window of Figure 20 also allows you to make changes to the configuration of the Security Log test. For this, you will have to click the  (Configure test) icon alongside the Test name in Figure 20. This will immediately launch the test configuration page of the Security Log test for the Citrix XenApp server being monitored (see Figure 21). Here, change the value of the failureeventsindd parameter to 10 and click the Update button to save the changes and return to the test details page.
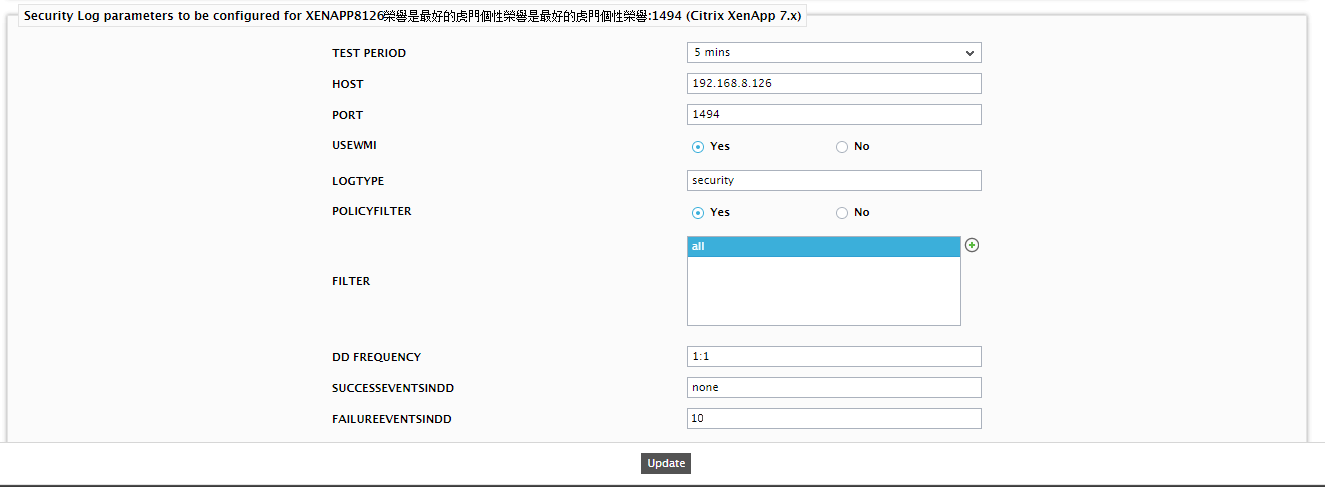
Figure 21 : Configuring the Security Log test
Likewise, you can also make quick changes to the threshold configuration of the Security Log test, without switching to the eG admin interface. For that, click on the (Configure thresholds) icon alongside the threshold settings displayed in Figure 20, or click on a measure name in the measures without thresholds section of Figure 20. This will bring up Figure 22, where you can change the thresholds of the selected measure.
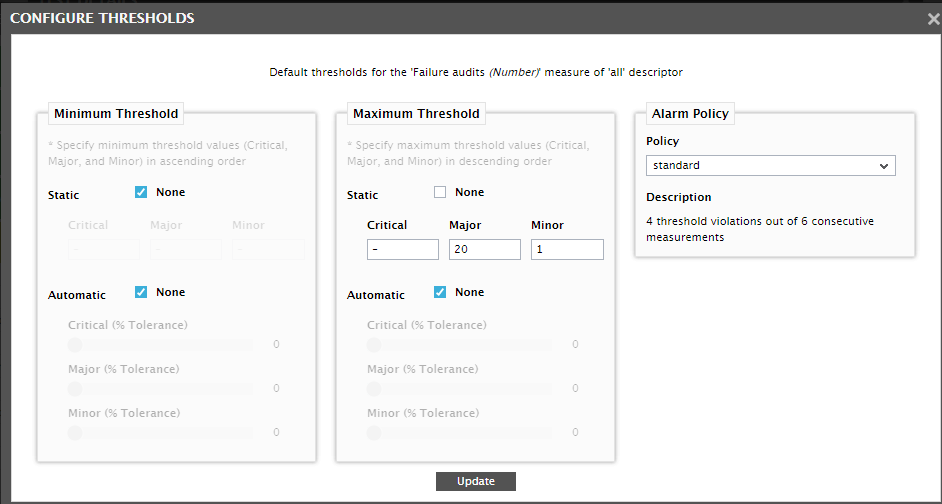
Figure 22 : Configuring the thresholds of the Security Log test
After making the necessary changes, click the Update button in Figure 22 to return to the test details page.
If a maintenance policy is associated with a test, then, during the configured maintenance period, the corresponding test name in the Layers tab page will be accompanied by a  icon (as shown in Figure 23).
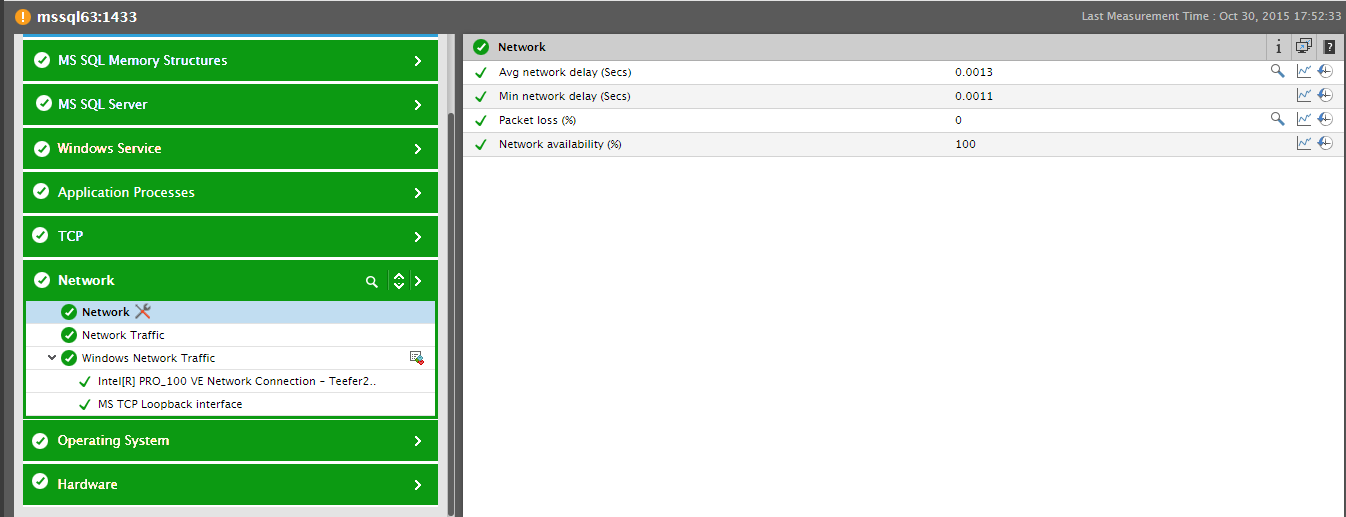
Figure 23 : A test under maintenance
The icon will continue to appear against the test name until such time that the test is under maintenance. Beyond this period, the icon will disappear. Whenever a test fails to report an expected anomaly, the appearance of the icon against the test name enables administrators to instantly conclude that a maintenance policy prevails during that period, owing to which no alarm was raised by eG Enterprise on that test. For more details about the maintenance policies associated with the test, click on the (Info) icon (indicated by Figure 23) that appears in the right panel, when the test is clicked. The test details page that appears next will include a Quick Maintenance Details section (see Figure 24), which will display the details of the maintenance policy that is currently active on that test.
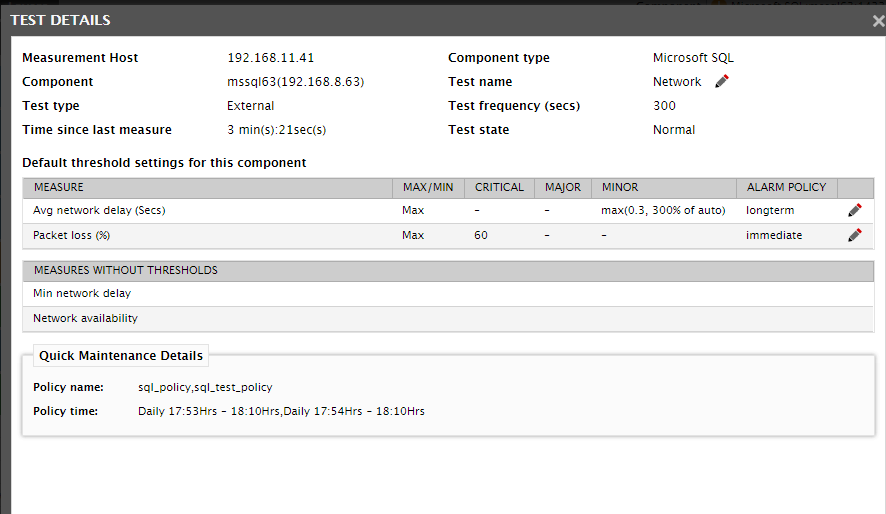
Figure 24 : Details of the maintenance policy that is currently active on a test