The System Dashboard
The System Dashboard of an application allows you to focus on the performance of the operating system on which that particular application runs - i.e., the Operating System layer of an application. While viewing the layer model of an application using the Layer Model tab page, you can, if you so want, instantly switch to its System Dashboard for in-depth insights into system performance; for this, click on the System tab page.
Figure 1 depicts a sample System Dashboard of a Java Application server.
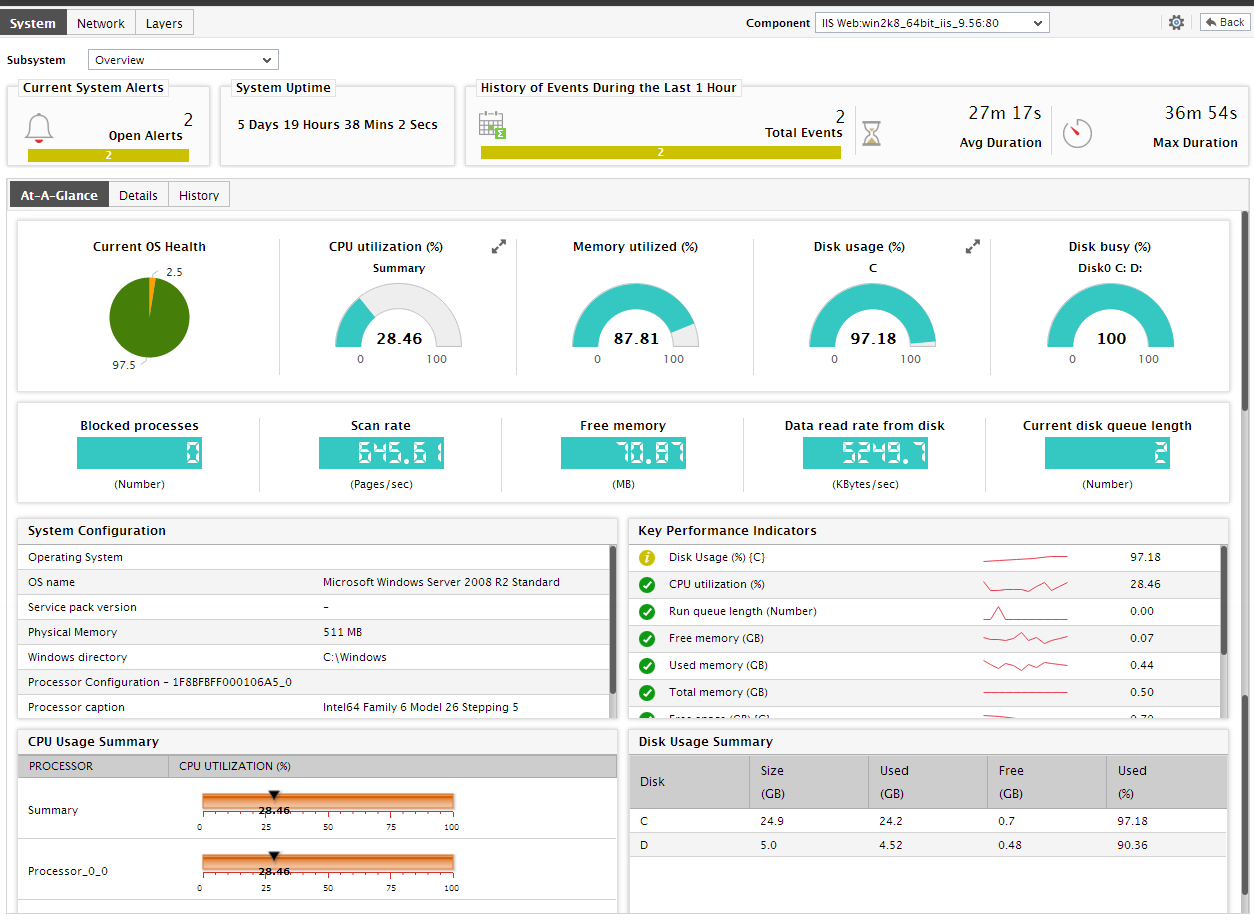
Figure 1 : The System Dashboard of a Java Application
Using the System Dashboard, administrators can determine the following:
- The current status of the application host;
- The problems that the host is currently facing, and the type and number of problems it encountered during the last 24 hours;
- The current system configuration (if the eG license enables the Configuration Management capability);
- The current state of the critical parameters related to system performance;
- How some of the sensitive performance parameters have performed during the last 1 hour (by default);
- The resource-hungry processors supported by the host, and the disk partitions on the host that are currently experiencing a space crunch.
By default, the System Dashboard provides an overview of system performance. Accordingly, the Overview option is chosen by default from the Subsystem list of Figure 1. Instead of an Overview, if you prefer to receive an inside view of system performance - i.e., if you wish to investigate how effectively / otherwise the system in question has been using each of its resources or would prefer to focus on the uptime of the host, you can pick a different option from Subsystem. The sections below discuss each of these options in great detail.