The Systems Tab Page
By default, selecting a zone node from the tree opens the Systems tab page. This tab page serves as a single, central interface that allows administrators to ascertain, from just a glance, the current operating system-level health of every component that is part of the chosen zone. The values of key host-level parameters are captured in real-time from all the components that belong to the chosen zone and are displayed here, so that administrators are instantly alerted to issues related to the network connection/traffic, TCP connectivity, and resource usage of every component.
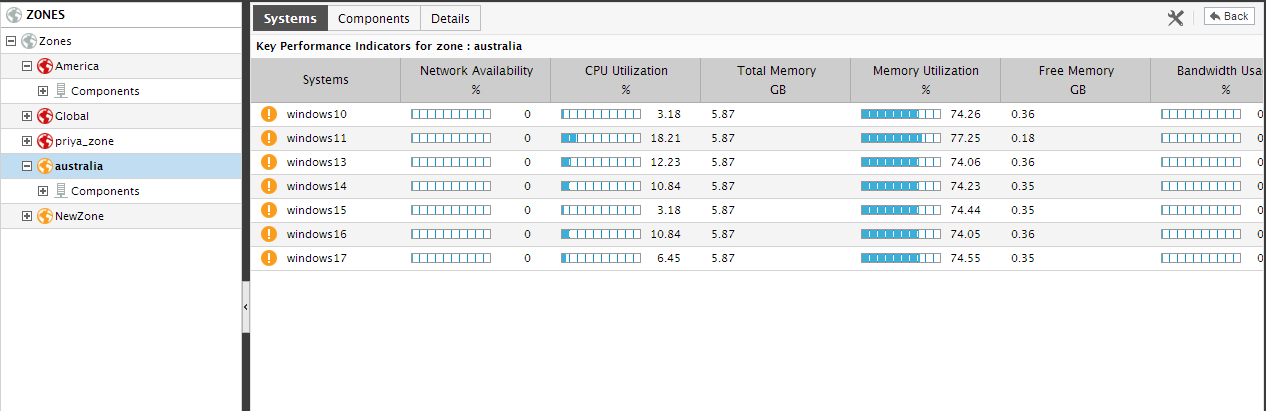
Figure 1 : The Systems tab page revealing operating system-level health of every component that is part of a zone
Clicking on a System in the right panel of Figure 1 will lead you to the layer model page, where you can view the exact layer where a problem has occurred, the test that reported the problem, and the problematic measure.
By default, the contents of the Systems tab page are sorted based on the state of the zone components listed therein. If more that one component exists in the same state, then the components of that state will be sorted in alphabetical order. If need be, you can change the sort order. For example, if you wish to sort the components listed in the Systems tab page in the descending order of the values of their Disk Usage, just click on the Disk Usage label. Doing so, tags the Disk Usage label with a down arrow icon – this icon indicates that the Systems tab page is currently sorted in the descending order of the total disk space used by each component. To change the sort order to ‘ascending’, all you need to do is just click again on the Disk Usage label or the down arrow icon. Similarly, you can sort the Systems tab page based on any column available in the table.
If you are an Admin user, then, you can override the default measure list in the Systems tab page by adding more critical measures to the list or by removing one/more existing ones from the list. For this, do the following:
-
Click on the
 icon provided near the Back button in Figure 2. In the Settings window that appears (see Figure 1), select Systems from the Tabs flag.
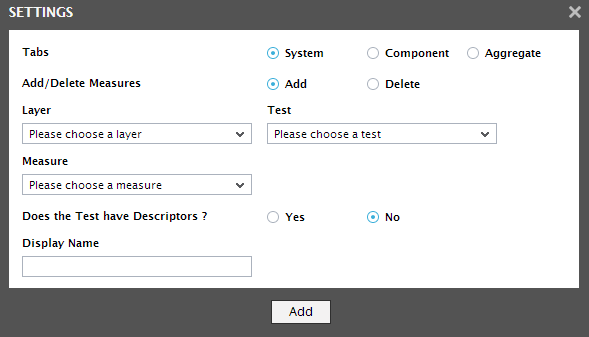
Figure 2 : Adding a measure to the Systems tab page of the Zone dashboard
- To add more metrics to the Systems tab page, first, select the Add option from the Add/Delete Measures flag.
- Next, select the layer for which you wish to add the test from the Layer drop down list. Now, select the Test that reports the measure of your choice, pick the measure of your interest from the Measures list, provide a Display name for the measure, and click the Add button to add the chosen measure to the Systems tab page.
-
If you want to delete one/more measures from this section, then, as soon as you choose the Delete option from the Add/Delete Measures flag, the Test drop down list will be populated with all the existing tests for which measures are displayed. Pick a Test and choose a Measure of your interest to delete from the Systems tab page.
Note:
- Only a user who is assigned the Admin role is allowed to customize the zone dashboard by clicking on the icon.
- While displaying values for descriptor-based measures in the Systems tab page, the eG Enterprise system does not display the actual values per descriptor. Instead, the solution computes the average or the total sum of values across descriptors and displays it in the corresponding measure column. For instance, for values reported as percentages, the solution computes the average value across descriptors. On the other hand, if the value is reported as a GB or MB, then the total sum of all the descriptor values of the component will be displayed against the component.
- Only a user who is assigned the Admin role is allowed to customize the zone dashboard by clicking on the