User Experience Dashboard
One of the biggest challenges that Citrix/virtual/terminal desktop administrators have is that they often have to spend time troubleshooting problems that may be caused in other parts of the infrastructure that they do not control. For instance, a slowdown in the home network that a user is connecting from can impact the user experience when accessing a Citrix service. eG Enterprise includes a User Experience Dashboard that makes it possible for end-users themselves to view the performance metrics related to their access to the Citrix/VDI/Terminal server infrastructure. This way, end users can easily determine when they see a slowdown, is the problem being caused by connectivity to the Citrix/VDI/Terminal server infrastructure, by any application(s) that they are using within a Citrix session, or by the Citrix infrastructure itself. If a performance problem is in the interconnecting network or in one of the applications the user has launched, the user can initiate corrective action (e.g., kill the offending process, contact the local network team, etc.) to alleviate the issue.
The self-service capability that the end-user performance dashboard provides results in fewer complaints and trouble calls to the Citrix/virtual desktop helpdesk. As a result, support costs are lower, end-users are less frustrated and the Citrix/virtual desktop deployment can proceed to successful completion.
End-users do not have to login to the eG monitoring console to access the dashboard. Administrators can publish the dashboard for public viewing. By accessing the URL, <eG Manager IP:Port>/final/monitor/endUserDashboard.jsp?username=<name of the user>, an end-user can get to see the performance of his / her Citrix or virtual desktop session or terminal server session.
Note:
Before attempting to access a published dashboard from 'outside' the eG monitoring console, do the following:
- Edit the eg_enduserDetails.ini file in the <EG_MANAGER_INSTALL_DIR>\manager\config directory (on Windows; on Unix, this will be the /opt/egurkha/manager/config directory).
- Look for the EndUserDashboardExternalAccess flag in the file. Once it is found, set the flag to true.
- Finally, save the file and restart the eG manager. If you do not want to restart the manager, then switch to the Admin tab page, follow the Settings -> Manager menu sequence in the Admin tile menu, click on the Advanced Settings node in the page that appears next, set the Update Manual Config Files flag to Yes, and click the Update button.
Citrix/Virtual desktop/Terminal server administrators can also use the same dashboard to handle user complaints. When a specific user calls, they can view the performance dashboard for that user and determine what action needs to be taken to resolve the issue. This industry first end-user performance dashboard for Citrix/virtual desktop/terminal server infrastructures greatly simplifies the day to day operation of a Citrix/virtual desktop infrastructure. To access this dashboard, a Citrix/VDI/Terminal server administrator registered with the eG Enterprise should first invoke the Monitor menu in the eG monitoring console, browse the Dashboards menu, move the mouse pointer over the Digital Workspaces group, and pick the Users option (see Figure 1).
Figure 1 : Accessing the User Experience dashboard
If Citrix Virtual Apps 7.x/XenApp 4/5/6.x servers, VDI servers, Terminal servers, Desktop Group and Microsoft AVD Host Pools are managed in your environment, then the administrator will first be lead to an interface that reveals at-a-glance, which user is currently logged into which VM/desktop across the virtual infrastructure, the current state of each VM/desktop, and an overview of each user’s experience with his/her VM/desktop. A quick look at this dashboard will point administrators to those users who are currently experiencing performance issues with their VMs/desktops and what the problem areas could be.
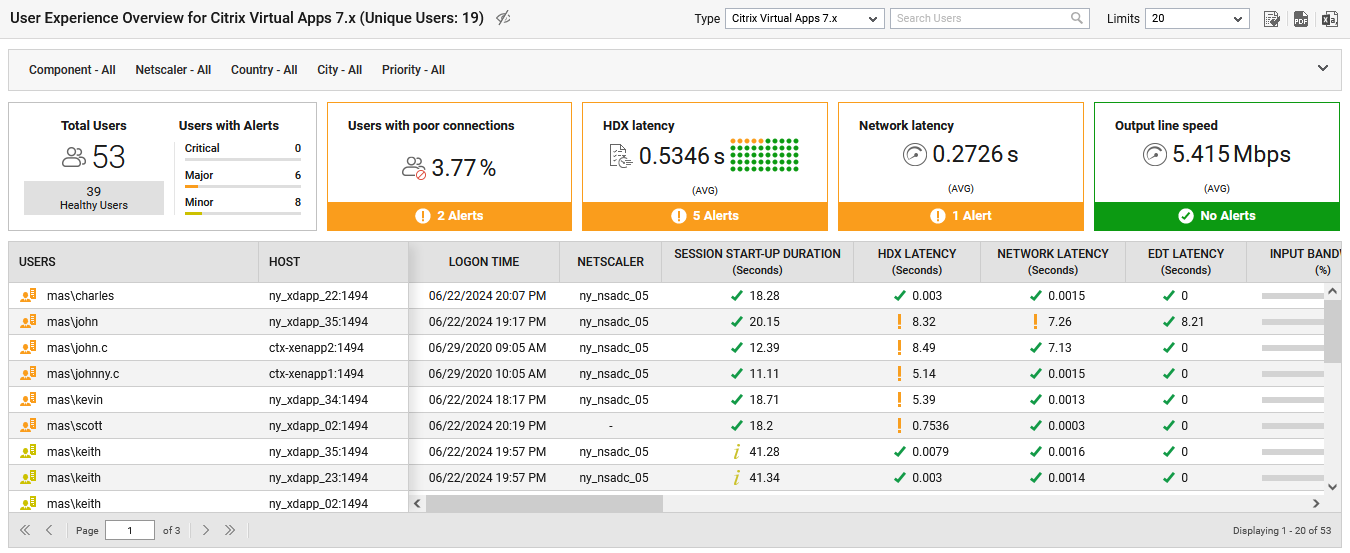
Figure 2 : The User Experience Dashboard Overview that can be viewed by the administrators
By default, this interface will list the number of unique users logged in the virtual environments. By default, this interface will list a maximum of 30 virtual desktops in the monitored environment, arranged in the order of their current state and then in the ascending order of their names. An administrator can however increase/decrease this default limit and can even add/delete the desktop health metrics that are displayed per desktop. To increase/decrease this default limit and to add/delete the desktop health metrics, administrators should navigate to the MONITOR SETTINGS page of the eG administrative interface. To know more about changing the default settings for the User Experience Dashboard, refer to the Administering eG Enterprise document. Administrators can override the default number of desktops displayed in the User Experience Overview Dashboard by selecting an appropriate number from the Limits list.
If the administrators want to view the user logins based on a chosen zone, then they can do so using the Zone list (see Figure 3). By default, All option is chosen from this list.
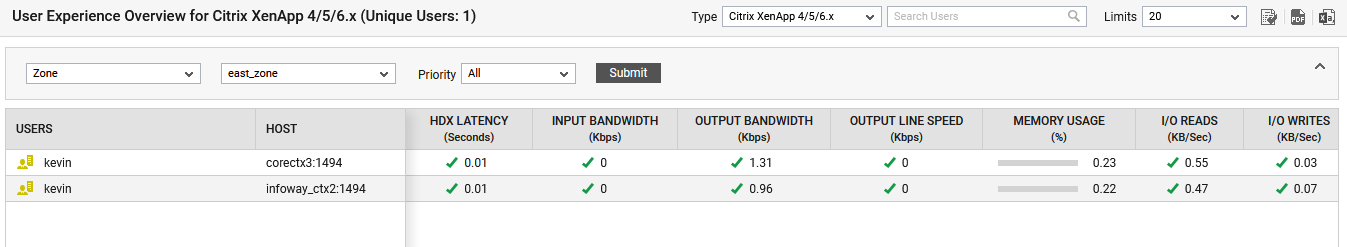
Figure 3 : The User Experience Overview dashboard based on a chosen zone
If the eG manager integrates with an Active Directory server, then optionally, administrators can configure the dashboard to display a list of AD groups to choose from. To know more on how to configure the dashboard to display the AD groups, refer to the of the Administering the eG Enterprise document. Once the dashboard is configured to display the user desktops based on Active Directory group, then, an additional View By list will appear. By default, the User option will be chosen from this list and the User Experience Overview dashboard would list all the desktops available in the target environment. If AD Group option is chosen from the View By list, then, an AD Group list will appear listing all the AD groups available in the target environment. By default, All option will be chosen from the AD Group list.
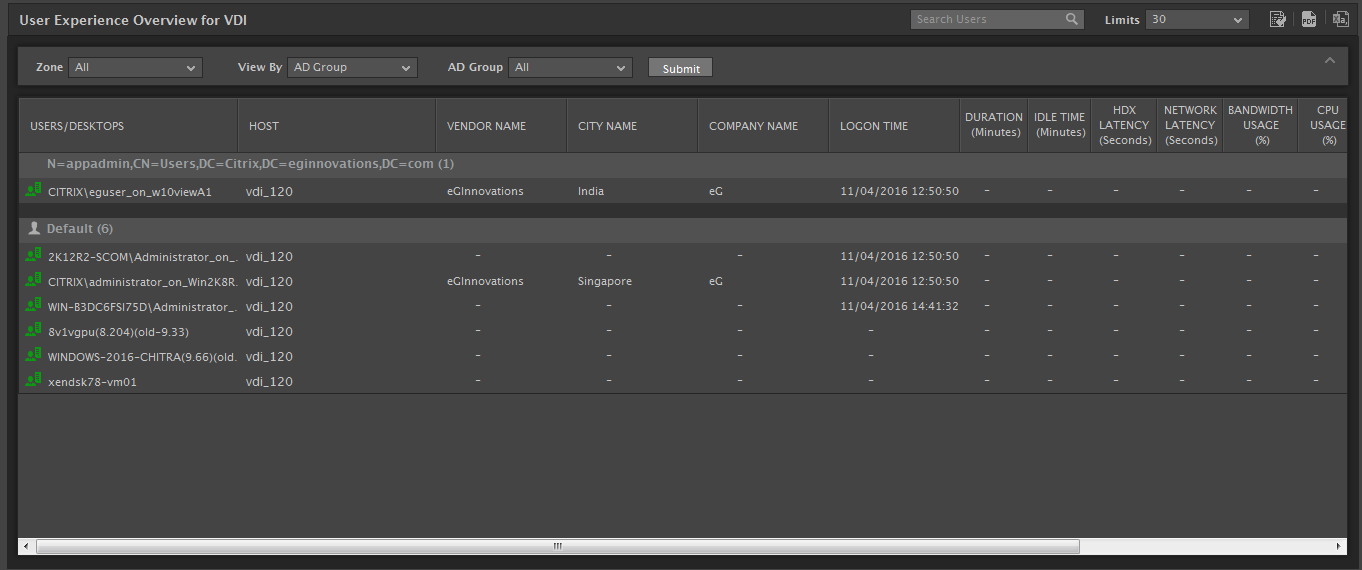
Figure 4 : The User Experience Overview dashboard if the eG manager is integrated with the AD server
By selecting a particular AD group, you can have the dashboard display the user experience metrics of only those currently logged in users who are part of the chosen group (see Figure 5)
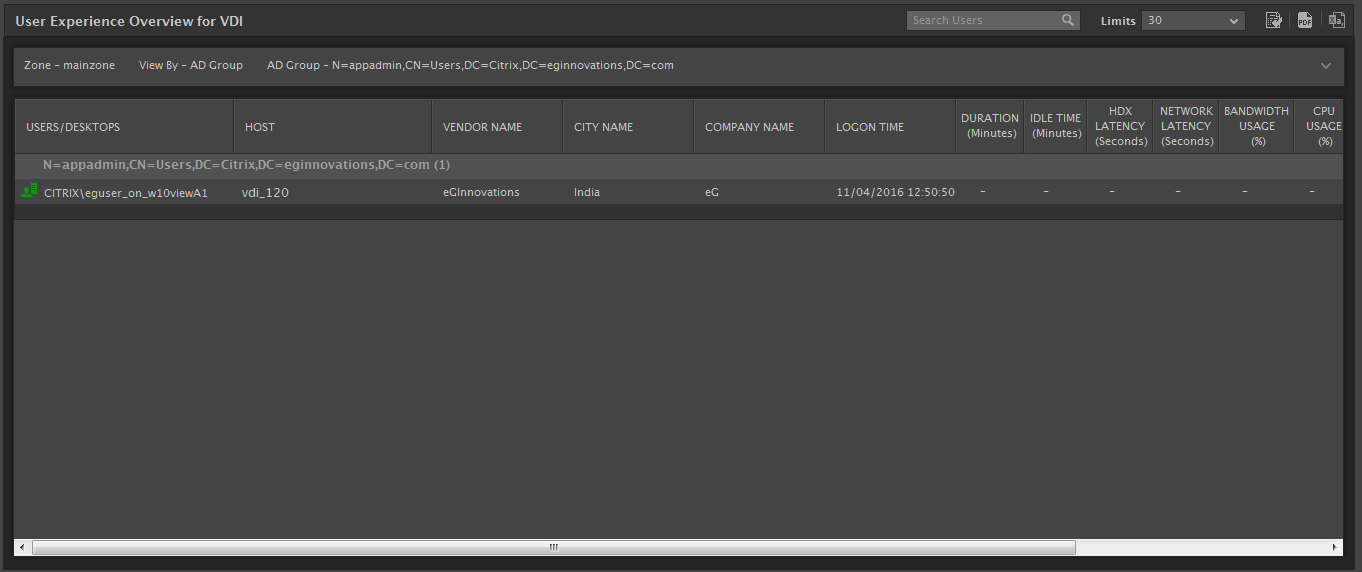
Figure 5 : Choosing an AD Group to view in the User Experience Overview dashboard
If the eG manager integrates with an AD server using LDAP authentication, the location of the users can be retrieved and displayed in the User Experience dashboard. The procedure to retrieve the information and display it in the User Experience dashboard is mentioned in section of the Administering the eG Enterprise document.
If administrators wanted to filter the users based on their location, then an additional Filter By list will appear. By default, City Name will be listed indicating that the users will be filtered based on their city and displayed in the User Experience Overview dashboard.
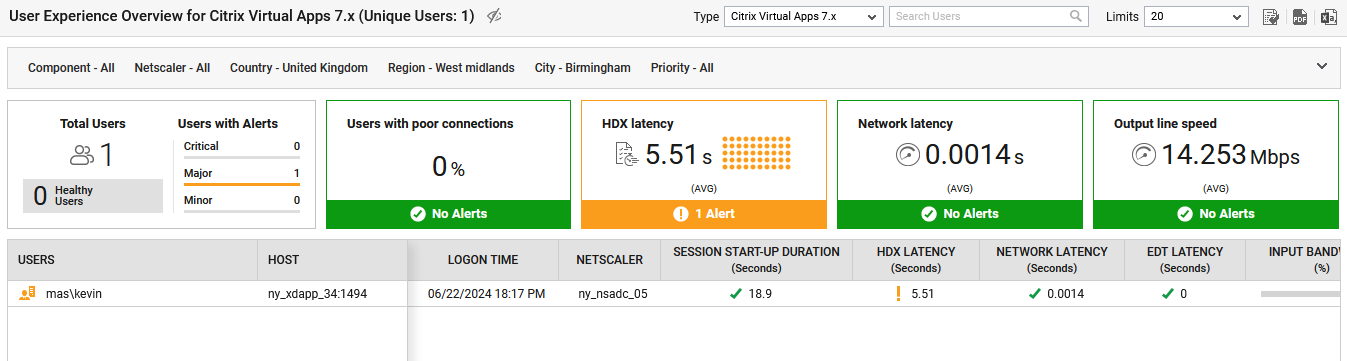
Figure 6 : Filtering the users based on their city in the User Experience Overview dashboard
If administrators would further like to drill down on the users of a particular location, then they can do so by selecting a city from the City Name list (see Figure 6).
To search for a user in the User Experience Overview dashboard, administrators can use the Search Users text box. Administrators can print the User Experience Overview dashboard using the  icon and export the User Experience Overview Dashboard in Microsoft Excel format using the
  icon.
icon.
For deeper analysis of user experience with a desktop, the administrator can click on any desktop in the Overview dashboard of Figure 2. This will invoke the User Experience Dashboard for the user who is currently logged into that desktop (see Figure 7). By default, the state of the measures is displayed against the measures in the widgets of the User Experience Dashboard.
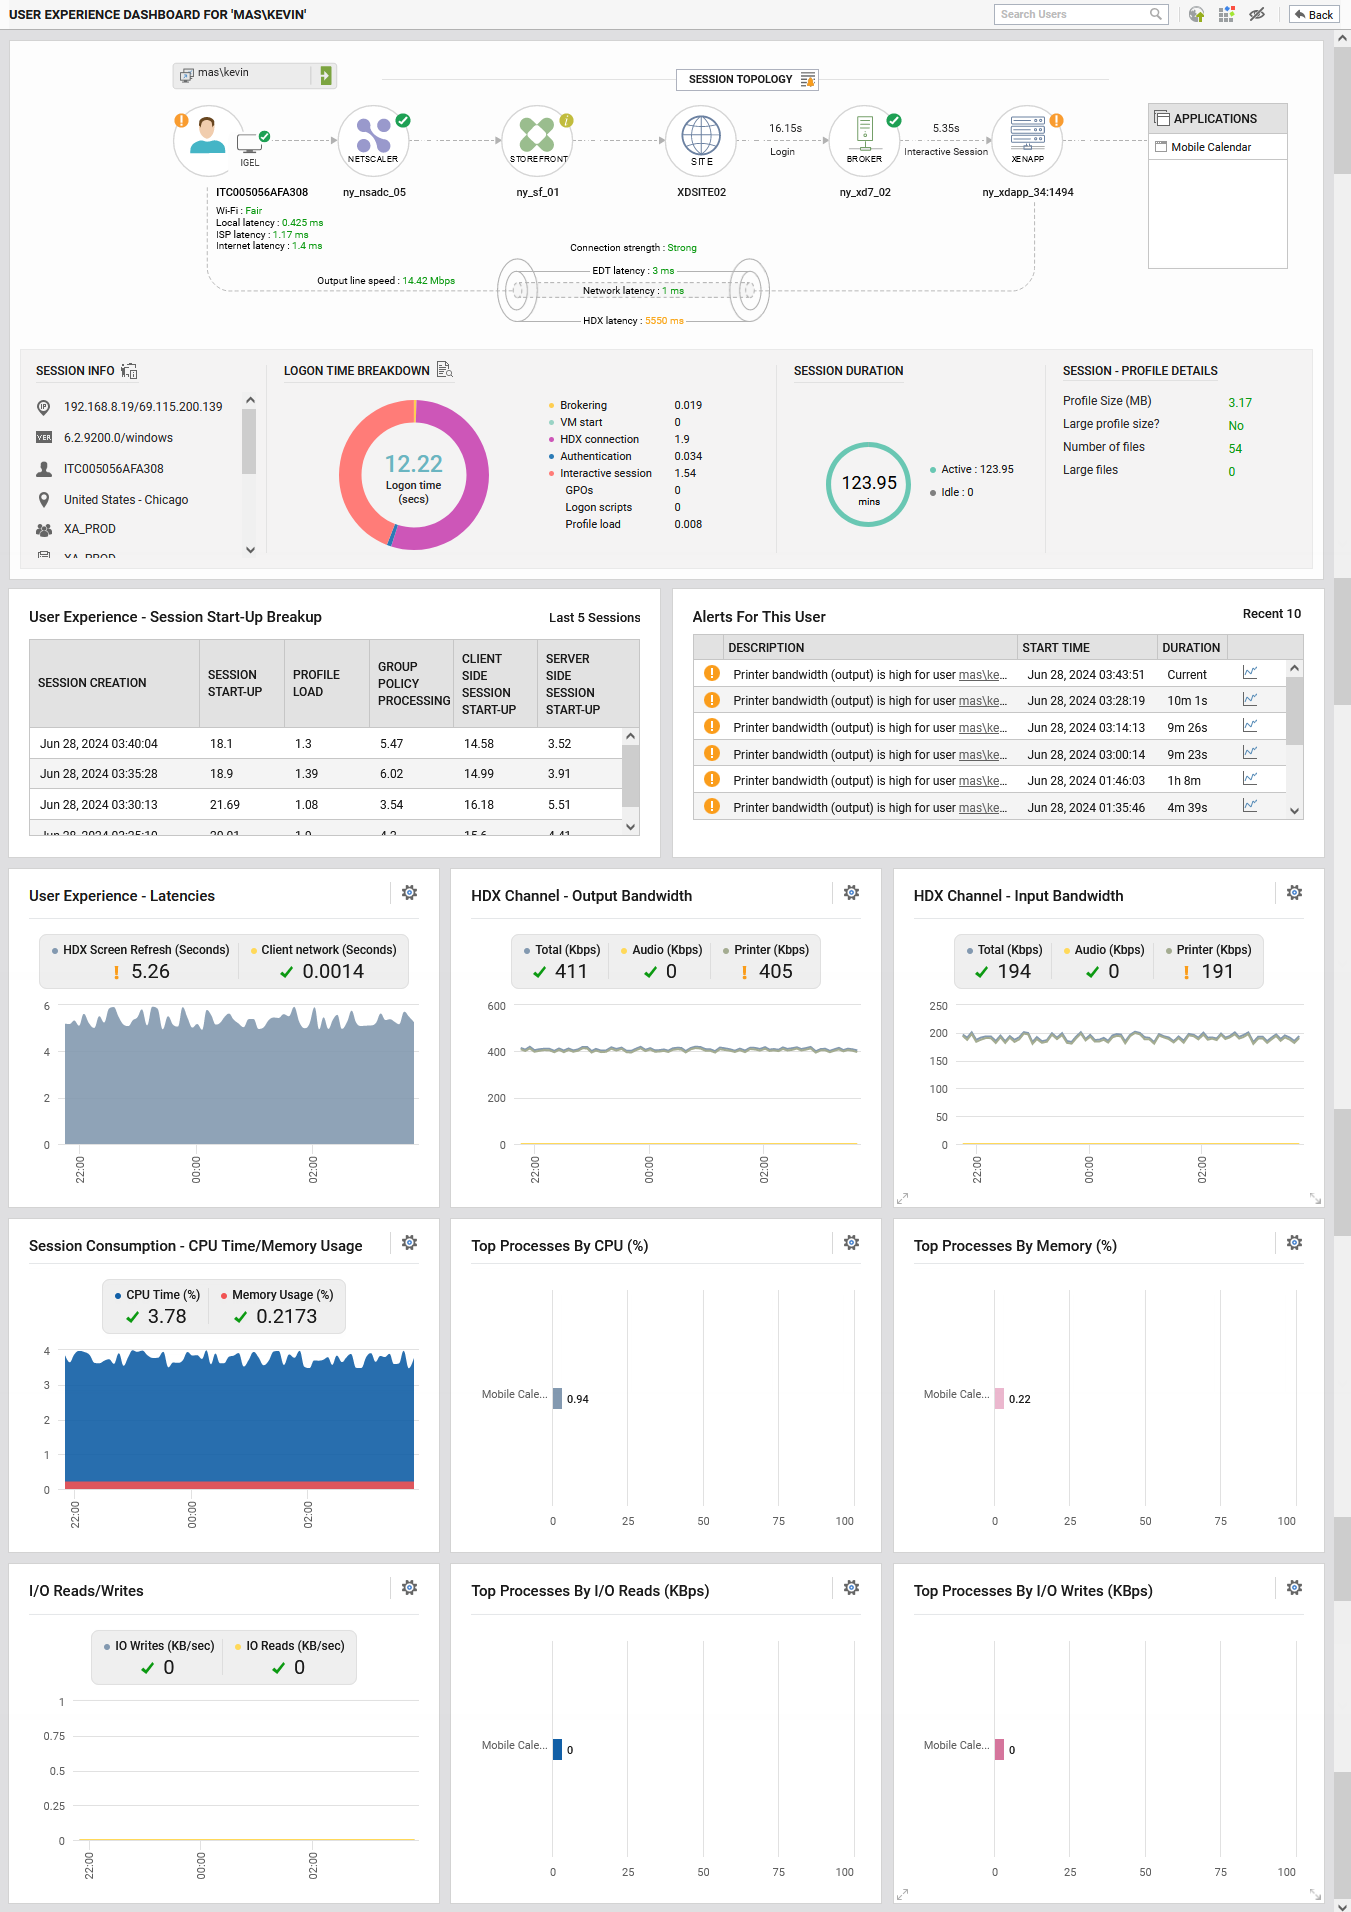
Figure 7 : The User Experience Dashboard
Note:
An end-user can just hit the URL, <eG Manager IP:Port>/final/monitor/endUserDashboard.jsp?username=<name of the user>, to instantly open this dashboard and review the impact of their operations on the health of their desktop.
By default, the User Experience Dashboard displays a wide variety of panels that reveal the following for a desktop user:
- ICA session details of the user, indicating whether/not the user is engaged in any bandwidth-intensive communication over the ICA channel, and if so, what type of communication it is;
- Recent alerts related to the user;
- How the user is consuming the network, CPU, memory, disk space, and disk I/O resources of the desktop;
- The processes run by the user on the desktop, which are the leading resource (CPU/memory/disk I/O) consumers
- When the user last accessed the desktop;
- TCP connections to and from the user’s desktop
From these default panels, administrators will be able to quickly pinpoint the exact source of a user’s poor experience with his/her virtual desktop. If required, administrators can hide those default panels that they deem unnecessary, replace them with new panels with newer, meaningful metrics, or can even modify the default panels slightly to include the performance information of interest to them. To perform this customization, administrators must click on the icon available in the right top corner of Figure 3. The sections to be followed will discuss in details on the following:
- Add a panel
- Modify an existing panel
- Delete custom panels
- Show/Hide default panels