Monitoring Mule ESB
eG Enterprise provides an exclusive Mule ESB monitoring model that provides an in-depth visibility into the performance, availability, and usage status of Mule ESB instances.
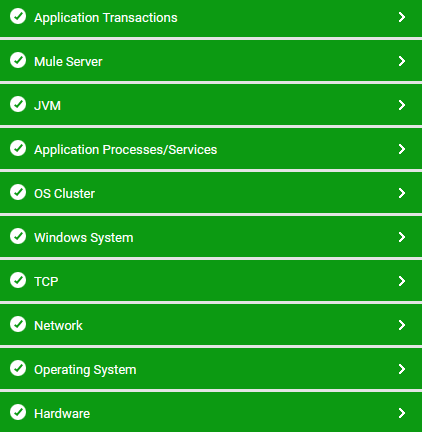
Figure 1 : The layer model of the Mule ESB
Using the model depicted by Figure 1, administrators can determine the following:
-
Is the number of fatal errors and execution errors high in each application deployed on the target Mule ESB?
-
Are there any Mule flows with high average event processing time?
-
Are the number of processed events in each Mule flow high?
-
Are there too many events processed by each Mule flow?
-
Is the memory utilization of each application too high? If so, then what is the percentage of memory used and free memory available?
This section will deal with the Mule Server layer of the layer model only, as the Network Layer, Application Transactions Layer, Application Processes/Services Layer, OS Cluster Layer, Windows System Layer, TCP Layer, Operating system Layer, and Hardware Layer have been discussed elaborately in theMonitoring Unix and Windows Servers document. The JVM layer has already been discussed elaborately in the Java Applications