MySQL Root Blockers Test
One common problem encountered with databases is blocking. Suppose that process A is modifying data that process B wants to use. Process B will be blocked until process A has completed what it is doing. This is only one type of blocking situation; others exist and are common. What matters to a database administrator is identifying when blocking is a problem and how to deal with it effectively. When blocking is bad enough, users will notice slowdowns and complain about it. With a large number of users, it is common for tens or hundreds of processes to be blocked when slowdowns are noticed. Killing these processes may or may not solve the problem because 10 processes may be blocked by process B, while process B itself is blocked by process A. Issuing 10 kill statements for the processes blocked by B probably will not help, as new processes will simply become blocked by B. Killing process B may or may not help, because then the next process that was blocked by B, which is given execution time, may get blocked by process A and become the process that is blocking the other 9 remaining processes. When you have lots of blocking that is not resolving in a reasonable amount of time you need to identify the root blocker, or the process at the top of the tree of blocked processes. Imagine again that you have 10 processes blocked by process B, and process B is blocked by process A. If A is not blocked by anything, but is itself responsible for lots of blocking (B and the 10 processes waiting on B), then A would be the root blocker. (Think of it as a traffic jam. Figure 1 will help) Killing A (via kill) is likely to unblock B, and once B completes, the 10 processes waiting on B are also likely to complete successfully.
The MySQL Root Blockers test reports the number of root blockers in a database. The detailed diagnosis of this test, provides the details of each of these root blockers. The count and details of sessions blocked by these root blockers are also reported. The maximum time for which the sessions were blocked, and the details of the processes that were blocking them are also revealed.
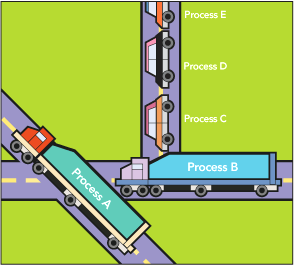
Figure 1 : The traffic jam analogy representing blocking
Target of the test : A MySQL server
Agent deploying the test : An internal agent
Outputs of the test : One set of results for sthe target database server instance being monitored.
| Parameter | Description |
|---|---|
|
Test Period |
How often should the test be executed. |
|
Host |
The IP address of the MySQL server. |
|
Port |
The port at which the specified host listens. |
|
Database |
Specify the name of a database on the target MySQL database server being monitored |
|
Username and Password |
The eG agent has to be configured with the credentials of a user who has server-wide Process and Select privileges on the monitored MySQL server. To know how to create such a user, refer to Pre-requisites for Monitoring the MySQL Server For this test to run, the user should additionally possess the following privilege. To configure the above-mentioned user with the specific privileges, issue the command given below: GRANT EXECUTE on *.* to '<username>'@'<IP_address_of_eG_agent>'; |
|
Confirm Password |
Confirm the password by retyping it here. |
|
Blocked Session Count |
Specify the minimum number of sessions a process should block for this test to count that process as a root blocker. For instance, if you specify 10 here, it indicates that the Root blockers measure of this test will include only those processes that are blocking 10 or more sessions. |
|
Max Blocking Time Seconds |
If a process is blocked for or beyond the duration (in seconds) specified here, then this test will count that process as a process that has been blocked for a long time. eG Enterprise will then compare the blocked time of all such processes and determine the maximum blocking time. This maximum time value will be reported as the value of the Maximum block time measure. Also, the detailed diagnosis of the Blocked sessions measure will list only those processes that were blocked for a period beyond the MAX BLOCKING TIME SECS configured. For example, if you specify 120 seconds here, then the detailed diagnosis of the Max blocking time measure will display the details of all processes that were blocked for 2 minutes and above. |
|
Show Explain Plan |
By default, this parameter is set to No indicating that the detailed diagnosis of this test will not list the detailed query plan of the root blockers. If you wish to view the detailed query plan for each root blocker reported by this test, then , set this flag to Yes. |
|
Verify CA |
If the eG agent is required to establish an encrypted connection with the target MySQL database server by authenticating the server's identity through verifying the server CA certificate, set Verify CA flag to Yes. By default, this flag is set to No. |
|
Truststore Password |
This parameter is applicable only if the Verify CA parameter is set to Yes. To verify the target server certificate, provide the password of the truststore file which contains the server CA certificate in the Truststore Password text box. By default, this parameter is set to none. |
|
Allow Public Key |
By default, the Allow Public Key flag is set to No. But, if the specified USER is created with caching_sha2_password as the authentication plugin, then the eG agent can connect to the target database cluster using RSA public key. To this effect, you have to set Allow Public Key flag to Yes. |
|
Confirm Password |
Confirm the Password by retyping it in the Confirm Password text box. |
|
Keystore Password |
This parameter is applicable only if the Verify CA parameter is set to Yes. To establish a connection with the target MySQL database server , the eG agent needs to have access to the client certificate. For this provide the password of the keystore file which contains the client certificate in the Keystore Password text box. By default, this parameter is set to none. |
|
Confirm Password |
Confirm the Password by retyping it in the Confirm Password text box. |
|
DD Frequency |
Refers to the frequency with which detailed diagnosis measures are to be generated for this test. The default is 1:1. This indicates that, by default, detailed measures will be generated every time this test runs, and also every time the test detects a problem. You can modify this frequency, if you so desire. Also, if you intend to disable the detailed diagnosis capability for this test, you can do so by specifying none against DD frequency. |
|
Detailed Diagnosis |
To make diagnosis more efficient and accurate, the eG Enterprise embeds an optional detailed diagnostic capability. With this capability, the eG agents can be configured to run detailed, more elaborate tests as and when specific problems are detected. To enable the detailed diagnosis capability of this test for a particular server, choose the On option. To disable the capability, click on the Off option. The option to selectively enable/disable the detailed diagnosis capability will be available only if the following conditions are fulfilled:
|
|
Measurement |
Description |
Measurement Unit |
Interpretation |
|---|---|---|---|
|
Root blockers |
Indicates the number of root blockers. |
Number |
This measure counts those processes that are blocking the number of processes configured against the BLOCKED SESSIONS parameter, as root blockers. A non-zero value for this measure is a cause for concern, as it indicates one/more root blockers. The detailed diagnosis of this test will list Blocking transaction ID, Blocking PID, Blocking username, Blocking time (in seconds), Blocking query, Waiting transaction ID, Waiting PID, Waiting username, Waiting host, Waiting database, Waiting query and Explain Query plan (if enabled). |
|
Maximum blocking time |
Indicates the maximum time for which a process blocked one/more processes. |
Seconds |
eG Enterprise isolates processes that have been blocking other processes for a duration greater than the configured MAX BLOCKING TIME. The blocking time of these processes is then compared and the maximum blocking time is identified and reported as the value of this measure. If this time is abnormally high, it indicates that a process been blocking resource access to other process(es) for a very long time. Prolonged blocking can significantly degrade database performance. Under such circumstances therefore, you can use the detailed diagnosis of the Blocked sessions measure to know which process was blocked for the maximum time and by which process. |
|
Blocked sessions |
Indicates the number of processes that are blocked. |
Number |
A high value of this measure indicates that a large number of processes are not allowed access to resources. Check the detailed diagnosis of this measure to know which processes were blocked for a duration greater than or equal to the MAX BLOCKING TIME configuration, and which processes were blocking them. |