MySQL User Activity Test
This test reports the number and state of the processes of each user who is currently connected to the MySQL server. Using the metrics reported by this test, administrators can promptly isolate idle processes, which are a drain on a server’s resources.
Target of the test : A MySQL server
Agent deploying the test : An internal/remote agent
Outputs of the test : One set of results for each user currently connected to the MySQL server monitored
| Parameter | Description |
|---|---|
|
Test Period |
How often should the test be executed. |
|
Host |
The IP address of the MySQL server. |
|
Port |
The port at which the specified host listens. |
|
Database |
Specify the name of a database on the target MySQL database server being monitored |
|
Username and Password |
The eG agent has to be configured with the credentials of a user who has server-wide Process and Select privileges on the monitored MySQL server. To know how to create such a user, refer to Pre-requisites for Monitoring the MySQL Server For the MySQL Bin Log test to run, the user should additionally possess the following privileges. To configure the above-mentioned user with the specific privileges, issue the commands given below: GRANT REPLICATION CLIENT on *.* to '<username>'@'<IP_address_of_eG_agent>'; GRANT REPLICATION SLAVE on *.* to '<username>'@'<IP_address_of_eG_agent>'; GRANT EXECUTE on *.* to '<username>'@'<IP_address_of_eG_agent>'; |
|
Confirm Password |
Confirm the password by retyping it here. |
|
Allow Public Key |
By default, the Allow Public Key flag is set to No. But, if the specified USER is created with caching_sha2_password as the authentication plugin, then the eG agent can connect to the target database cluster using RSA public key. To this effect, you have to set Allow Public Key flag to Yes. |
|
Idle Time |
Specify the time duration (in seconds) above which the processes that are waiting in the database will be regarded as idle. |
|
SSL |
By default, the SSL flag is set to No, indicating that the target MySQL database server is not SSL-enabled by default. To enable the test to connect to an SSL-enabled MySQL database server , set the SSL flag to Yes. |
|
Verify CA |
If the eG agent is required to establish an encrypted connection with the target MySQL database server by authenticating the server's identity through verifying the server CA certificate, set Verify CA flag to Yes. By default, this flag is set to No. |
|
Truststore Password |
This parameter is applicable only if the Verify CA parameter is set to Yes. To verify the target server certificate, provide the password of the truststore file which contains the server CA certificate in the Truststore Password text box. By default, this parameter is set to none. |
|
Confirm Password |
Confirm the Password by retyping it in the Confirm Password text box. |
|
Keystore Password |
This parameter is applicable only if the Verify CA parameter is set to Yes. To establish a connection with the target MySQL database server , the eG agent needs to have access to the client certificate. For this provide the password of the keystore file which contains the client certificate in the Keystore Password text box. By default, this parameter is set to none. |
|
Confirm Password |
Confirm the Password by retyping it in the Confirm Password text box. |
|
Detailed Diagnosis |
To make diagnosis more efficient and accurate, the eG Enterprise embeds an optional detailed diagnostic capability. With this capability, the eG agents can be configured to run detailed, more elaborate tests as and when specific problems are detected. To enable the detailed diagnosis capability of this test for a particular server, choose the On option. To disable the capability, click on the Off option. The option to selectively enable/disable the detailed diagnosis capability will be available only if the following conditions are fulfilled:
|
| Measurement | Description | Measurement Unit | Interpretation |
|---|---|---|---|
|
Total processes: |
Indicates the total number of processes for this user. |
Number |
The detailed diagnosis of this measure if enabled, lists out all the processes for this user. |
|
Active processes: |
Indicates the number of processes of this user that are currently active. |
Number |
The detailed diagnosis of this measure indicates the exact active processes of this user and the time for which the processes are actually active. |
|
Inactive processes: |
Indicates the processes that were inactive for this user in this database. |
Number |
The detailed diagnosis of this measure if enabled, indicates the inactive processes of this user and the time for which the processes were inactive. |
|
Idle processes: |
Indicates the processes that are idle for this user in this database. |
Number |
The detailed diagnosis of this measure if enabled, indicates the idle processes of this user and the time for which the processes were idle. |
The detailed diagnosis of the Active processes measure, if enabled, will indicatethe exact active processes of this user and the time for which the processes were actually active.
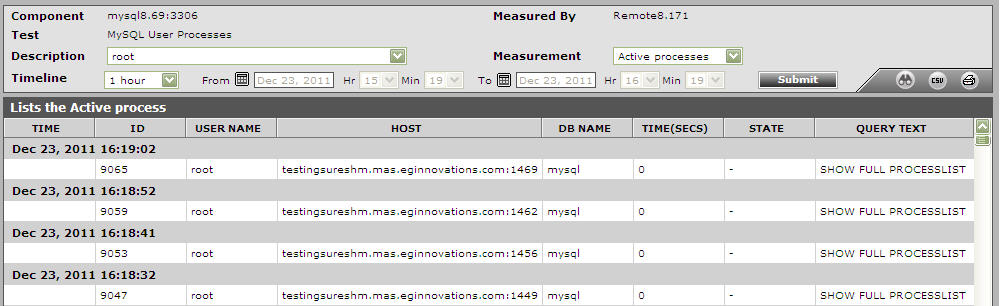
Figure 1 : The detailed diagnosis of the Active processes measure
The detailed diagnosis of this measure if enabled, indicates the idle processes of this user and the time for which the processes were idle. Using this information, you can understand how each of the idle connections were made - i.e., using which program - and from where - i.e., from which host.
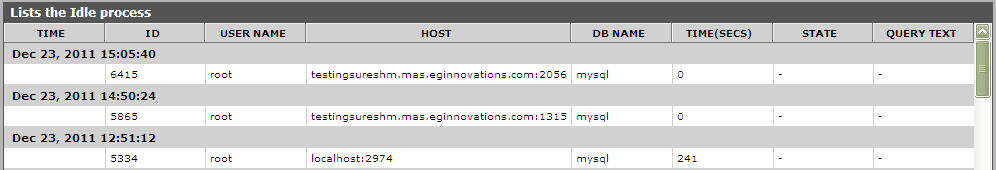
Figure 2 : The detailed diagnosis of the Idle processes meaure