How to Monitor NetApp NetCache Using eG Enterprise?
eG Enterprise monitors the NetApp NetCache using a single eG external agent on any remote host in the environment. This agent is capable of polling the SNMP MIB Of the NetApp NetCache at regular intervals and fetching statistics related its performance.
The broad steps for monitoring NetApp NetCache using eG Enterprise are as follows:
- Managing the NetApp NetCache
- Configuring the tests
These steps have been discussed in following sections.
Managing the NetApp NetCache
The eG Enterprise cannot automatically discover the NetApp NetCache. This implies that you need to manually add the component for monitoring. Remember that the eG Enterprise automatically manages the components that are added manually. To manage a NetApp NetCache component, do the following:
- Log into the eG administrative interface.
- Follow the Components -> Add/Modify menu sequence in the Infrastructure tile of the Admin menu.
-
In the COMPONENT page that appears next, select NetApp NetCache as the Component type. Then, click the Add New Component button. This will invoke Figure 1.
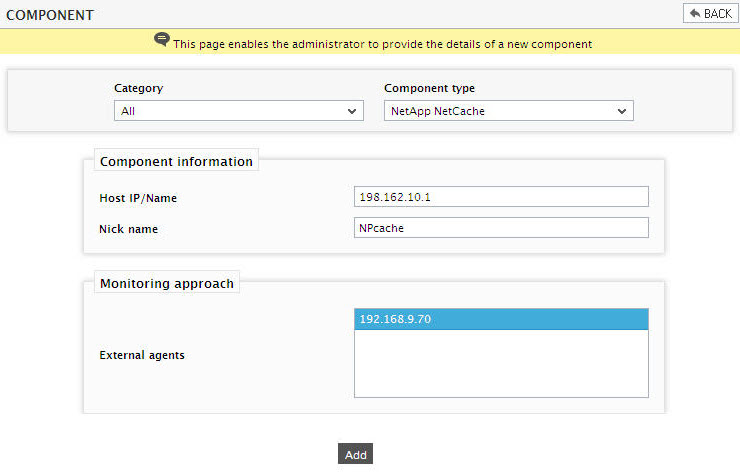
- Specify the Host IP and the Nick name for the NetApp NetCache in Figure 1. Then, click the Add button to register the changes.
Configuring the tests
-
When you attempt to sign out of eG administrative interface, a list of unconfigured tests will appear as shown in Figure 2. This list reveals the unconfigured tests requiring manual configuration.
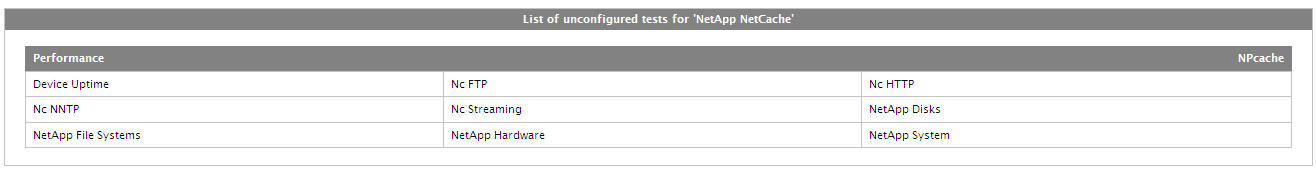
Figure 2 : List of unconfigured tests for the NetApp NetCache
- To configure the tests, click on the test names in the list of unconfigured tests. For the details on configuring the tests, refer to Monitoring NetApp NetCache chapter.
- Once all the tests are configured, signout of the eG administrative interface.