TCP Connectivity to Target Test
The TCP Connectivity to Target test is used to the check the availability of TCP connection between source and destination. Monitoring the TCP connection can help identify potential bottlenecks or issues that may be affecting network performance. By keeping track of availability, you can ensure that the network is operating efficiently and effectively. This test allows you to quickly identify and resolve any connectivity issues that may arise. It can help pinpoint the source of the problem and take corrective action in a timely manner.
Response time is a key indicator of the performance of network paths and connectivity. Slow response times can indicate network congestion, hardware issues, or other problems that may be affecting the overall performance of the network. Monitoring response time can help identify and troubleshoot issues with network paths and connectivity. Using this test, the administrators can track the response time over time, and identify patterns and potential points of failure. This test also helps the administrators to detect and respond to potential security threats, if any.
Target of the test : Network Path
Agent deploying the test : An external agent
Outputs of the test : One set of results measured from eG agent to Host URL: Port.
| Parameter | Description |
|---|---|
|
Test period |
How often should the test be executed. |
|
Host |
In the Host text box, specify the destination URL for which this test is to be configured. |
|
Port |
The port number through which the Network Path communicates. |
|
Targets |
Provide a comma-separated list of {Host URL}:{Port} pair combination in the TARGETS text box, which represent the Host URLs (destination) for which the TCP connectivity to be monitored from the server (source) . For example, www.google.com:443,www.npcap.com:443. The test connects to each URL/Port pair combination and monitors the TCP connectivity between the source and the destination. One set of metrics is reported for each target. |
|
Timeout |
Specify the duration (in miiliseconds) within which this test should time out in this text box. The default is 500 . |
|
DD Frequency |
Refers to the frequency with which detailed diagnosis measures are to be generated for this test. The default is 1:1. This indicates that, by default, detailed measures will be generated every time this test runs, and also every time the test detects a problem. You can modify this frequency, if you so desire. Also, if you intend to disable the detailed diagnosis capability for this test, you can do so by specifying none against DD frequency. |
|
Detailed Diagnosis |
To make diagnosis more efficient and accurate, the eG Enterprise embeds an optional detailed diagnostic capability. With this capability, the eG agents can be configured to run detailed, more elaborate tests as and when specific problems are detected. To enable the detailed diagnosis capability of this test for a particular server, choose the On option. To disable the capability, click on the Off option. The option to selectively enable/disable the detailed diagnosis capability will be available only if the following conditions are fulfilled:
|
| Measurement | Description | Measurement Unit | Interpretation | ||||||
|---|---|---|---|---|---|---|---|---|---|
|
Availability |
Indicates the availability of TCP connection between the source and destination. |
|
The values reported by this measure and its numeric equivalents are mentioned in the table below:
Note: By default, this measure reports the Measure Values listed in the table above to indicate the availability of TCP connection between the source and destination. However, in the graph of this measure, values will be represented using the corresponding numeric equivalents only. |
||||||
|
Response time |
Indicates the time taken by the data to travel from source to destination. |
Milliseconds |
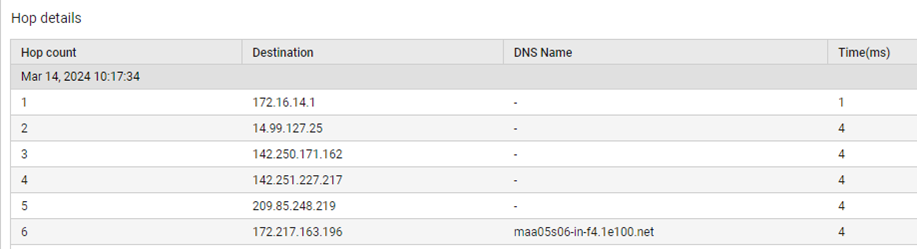
The detailed diagnosis of this measure lists the count of hops, Destination IPs, DNS Name and calculates the average response time taken by each hop. |
The detailed diagnosis capability of the Response time measure, if enabled, provides a listing of number of hops (see Figure 1), Destination IPs, DNS Name and the average response time taken by each hop.