Monitoring the NexentaStor
eG Enterprise offers a specialized monitoring model for the NexentaStor appliance.

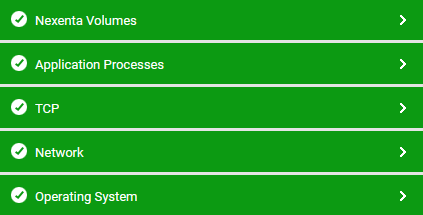
Figure 1 : The layer model of the NexentaStor
Each layer of this model is mapped to tests that report on the overall health, I/O performance, and resource usage of the NexentaStor appliance. Using the metrics so reported, the following performance queries can be easily answered:
- Is any volume processing I/O requests very slowly?
- Is any volume running out of space?
- Which volume is currently in a faulty/degraded state?
- Is the storage appliance using memory excessively?
- Is the appliance overloaded with users sessions?
The Operating System, Network, TCPand Application Processes layers of a NexentaStor model are similar to that of a Windows Generic server model. Since these tests have been dealt with in the Monitoring Unix and Windows Servers document, the upcoming section focuses on the Nexenta Volumes layer.