AHV Content Cache Test
The Content Cache (aka “Elastic Dedupe Engine”) is a deduped read cache which spans both the CVM’s memory and SSD. Upon a read request of data not in the cache (or based upon a particular fingerprint) the data will be placed in to the single-touch pool of the content cache which completely sits in memory where it will use LRU until it is ejected from the cache. Any subsequent read request will “move” (no data is actually moved, just cache metadata) the data into the memory portion of the multi-touch pool which consists of both memory and SSD. From here there are two LRU cycles, one for the in-memory piece upon which eviction will move the data to the SSD section of the multi-touch pool where a new LRU counter is assigned. Any read request for data in the multi-touch pool will cause the data to go to the peak of the multi-touch pool where it will be given a new LRU counter.
Figure 1 below provides a high-level overview of the content cache:
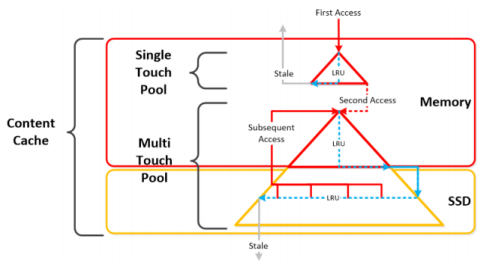
Figure 1 : A high-level overview of the content cache
If the content cache is not sized right, then the cache will not be able to hold frequently accessed data, and will hence be unable to service many read requests. This could increase direct disk accesses and related overheads, thereby degrading overall storage performance. To ensure peak storage performance therefore, the usage of the cache should be continuously monitored, cache misses should be promptly captured, and the reasons for the same should be diagnosed. This is exactly what the AHV Content Cache test helps perform.
This test closely monitors the content cache, tracks the cache hit ratio, and alerts administrators if the ratio dips below acceptable limits. In addition, the test also monitors how the cache memory is utilized in the single-touch and multi-touch pools, thus pointing administrators to sizing deficiencies that could be contributing to the high rate of cache misses (if any). Using the pointers provided by this test, administrators can right size the cache and improve cache and overall storage efficiency.
Target of the test : A Nutanix AHV server
Agent deploying the test : A remote agent
Outputs of the test : One set of results for the Nutanix AHV server monitored.
| Parameter | Description |
|---|---|
|
Test Period |
How often should the test be executed |
|
Host |
The host for which the test is to be configured. |
|
Port |
The port at which the specified host listens. By default, this is NULL |
|
Prism Element IP |
If the eG manager had discovered the target Nutanix AHV server by connecting to the Nutanix Prism Element, then the IP address of the Nutanix Prism Element server used for discovering this Nutanix AHV server would be automatically displayed against the Prism Element IP parameter; similarly, the Prism Element User and Prism Element Password text boxes will be automatically populated with the Prism Element user credentials, using which Nutanix AHV discovery was performed. If this Nutanix AHV server has not been discovered using the Nutanix Prism Element, but you still want to monitor the Nutanix AHV server via the Prism Element, then select the IP address of the Prism Element server that you wish to use for monitoring the Nutanix AHV server from the Prism Element IP list. By default, this list is populated with the IP address of all Nutanix Prism Element hosts that were added to the eG Enterprise system at the time of discovery. Upon selection, the Prism Element user and Prism Element Password that were pre-configured for that Nutanix Prism Element will be automatically displayed against the respective text boxes. On the other hand, if the IP address of the Prism Element server of interest to you is not available in the list, then, you can add the details of the Prism Element server on-the-fly, by selecting the Other option from the Prism Element IP list. This will invoke the MANAGER DISCOVERY - VIRTUAL PLATFORM SETTINGS page. Refer to the Configuring eG Enterprise to Monitor Nutanix AHV |
|
Prism Element User, Prism Element Password and Confirm Password |
If the eG manager had discovered the target Nutanix AHV server by connecting to the Nutanix Prism Element, then the IP address of the Nutanix Prism Element server used for discovering this Nutanix AHV server would be automatically displayed against thePrism Element IP parameter; similarly, the Prism Element User and Prism Element Password text boxes will be automatically populated with the Prism Element user credentials, using which Nutanix AHV discovery was performed. If this Nutanix AHV server has not been discovered using the Nutanix Prism Element, but you still want to monitor the Nutanix AHV server via the Prism Element, then select the IP address of the Prism Element server that you wish to use for monitoring the Nutanix AHV server from the Prism Element IP list. By default, this list is populated with the IP address of all Nutanix Prism Element hosts that were added to the eG Enterprise system at the time of discovery. Upon selection, the Prism Element User and Prism Element Password that were pre-configured for that Prism Element server will be automatically displayed against the respective text boxes. On the other hand, if the IP address of the Prism Element server of interest to you is not available in the list, then, you can add the details of the Prism Element server on-the-fly, by selecting the Other option from the Prism Element IP list. This will invoke the MANAGER DISCOVERY - VIRTUAL PLATFORM SETTINGS page. Refer to the Configuring eG Enterprise to Monitor Nutanix AHV |
|
SSL |
By default, the Nutanix Prism Element server is SSL-enabled. Accordingly, the SSL flag is set to Yes by default. This indicates that the eG agent will communicate with the Prism Element server via HTTPS by default. |
|
WebPort |
By default, the Nutanix Prism Element server listens on port 9440. This implies that while monitoring a Nutanix AHV server via the Prism Element server, the eG agent connects to port 9440. |
|
DD Frequency |
Refers to the frequency with which detailed diagnosis measures are to be generated for this test. The default is 1:1. This indicates that, by default, detailed measures will be generated every time this test runs, and also every time the test detects a problem. You can modify this frequency, if you so desire. Also, if you intend to disable the detailed diagnosis capability for this test, you can do so by specifying none against DD frequency. |
| Measurement | Description | Measurement Unit | Interpretation |
|---|---|---|---|
|
Cache hits |
Indicates the number of times read requests were served from this cache during the last measurement period. |
Number |
Ideally, the value of this measure should be close to or equal to the value of the Cache lookups measure. |
|
Cache hit ratio |
Indicates the ratio of cache hits to cache lookups. |
Percent |
Ideally, the value of this measure should be over 80%. If so, then it indicates that almost all read requests were served by the cache. This means that direct disk accesses and related processing overheads were minimal. A value less than 50% signifies ineffective cache usage. In other words, most of the cache lookups did not result in cache hits. One of the key reasons for this could be poor cache size. If the cache does not have enough memory resources to hold data, it may not be able to service read requests. This will increase direct disk accesses, which are I/O-intensive operations. |
|
Physical memory usage |
Indicates the amount of real memory that is consumed by the data in the content cache. |
MB |
A consistent increase in the value of this measure could mean that cache misses are high, owing to which new data is being continuously written to the cache. In the process, more memory is being consumed. |
|
Cache lookups |
Indicates the number of times the cache was looked up for serving read requests during the last measurement period. |
Number |
|
|
Saved memory usage |
Indicates the amount of content cache memory saved due to deduplication. |
MB |
Performance tier deduplication removes duplicate data in the content cache (SSD and memory) to reduce the footprint of an application’s working set. This enables more working data to be managed in the content cache. Therefore, higher the value of this measure, more significant will be the performance improvements. |
|
Logical SSD usage |
Indicates the logical SSD memory used to cache data without deduplication. |
MB |
|
|
Logical memory usage |
Indicates the logical memory used to cache data without deduplication. |
MB |
|
|
SSD usage |
Indicates the real SSD memory used to cache data. |
MB |
If data in the single-touch pool of the content cache is accessed, it is moved to the in-memory portion of the multi-touch pool. Here again, it follows an LRU cycle, based on which the 'oldest objects'in memory are identified and moved to the SSD portion of the multi-touch pool. If the data in SSD is accessed, it is moved to the top of the multi-touch pool, from where it will be served. Any increase in the usage of the SSD portion of the multi-touch pool can be attributed to the addition of data that is not-so-frequently accessed. If the SSD is not sized right, then data will be discarded from the pool sooner than desired. In the absence of enough data, cache misses will increase, and so will the overheads of direct disk accesses. |
|
SSD usage saved |
Indicates the memory saved in SSD owing to deduplication. |
MB |
Performance tier deduplication removes duplicate data in the content cache (SSD and memory) to reduce the footprint of an application’s working set. This enables more working data to be managed in the content cache. Therefore, higher the value of this measure, more significant will be the performance improvements. |