Handles Usage - OS Test
This test monitors and tracks the handles opened by processes running in a target Windows virtual machine.
Target of the test : A Nutanix AHV server
Agent deploying the test : A remote agent
Outputs of the test : One set of results for each powered-on guest/currently logged-in user on the Nutanix AHV server monitored.
| Parameter | Description |
|---|---|
|
Test Period |
How often should the test be executed |
|
Host |
The host for which the test is to be configured. |
|
Port |
The port at which the specified host listens. By default, this is NULL |
|
Prism Element IP |
If the eG manager had discovered the target Nutanix AHV server by connecting to the Nutanix Prism Element, then the IP address of the Nutanix Prism Element server used for discovering this Nutanix AHV server would be automatically displayed against the Prism Element IP parameter; similarly, the Prism Element User and Prism Element Password text boxes will be automatically populated with the Prism Element user credentials, using which Nutanix AHV discovery was performed. If this Nutanix AHV server has not been discovered using the Nutanix Prism Element, but you still want to monitor the Nutanix AHV server via the Prism Element, then select the IP address of the Prism Element server that you wish to use for monitoring the Nutanix AHV server from the Prism Element IP list. By default, this list is populated with the IP address of all Nutanix Prism Element hosts that were added to the eG Enterprise system at the time of discovery. Upon selection, the Prism Element user and Prism Element Password that were pre-configured for that Nutanix Prism Element will be automatically displayed against the respective text boxes. On the other hand, if the IP address of the Prism Element server of interest to you is not available in the list, then, you can add the details of the Prism Element server on-the-fly, by selecting the Other option from the Prism Element IP list. This will invoke the MANAGER DISCOVERY - VIRTUAL PLATFORM SETTINGS page. Refer to the Configuring eG Enterprise to Monitor Nutanix AHV |
|
Prism Element User, Prism Element Password and Confirm Password |
If the eG manager had discovered the target Nutanix AHV server by connecting to the Nutanix Prism Element, then the IP address of the Nutanix Prism Element server used for discovering this Nutanix AHV server would be automatically displayed against thePrism Element IP parameter; similarly, the Prism Element User and Prism Element Password text boxes will be automatically populated with the Prism Element user credentials, using which Nutanix AHV discovery was performed. If this Nutanix AHV server has not been discovered using the Nutanix Prism Element, but you still want to monitor the Nutanix AHV server via the Prism Element, then select the IP address of the Prism Element server that you wish to use for monitoring the Nutanix AHV server from the Prism Element IP list. By default, this list is populated with the IP address of all Nutanix Prism Element hosts that were added to the eG Enterprise system at the time of discovery. Upon selection, the Prism Element User and Prism Element Password that were pre-configured for that Prism Element server will be automatically displayed against the respective text boxes. On the other hand, if the IP address of the Prism Element server of interest to you is not available in the list, then, you can add the details of the Prism Element server on-the-fly, by selecting the Other option from the Prism Element IP list. This will invoke the MANAGER DISCOVERY - VIRTUAL PLATFORM SETTINGS page. Refer to the Configuring eG Enterprise to Monitor Nutanix AHV |
|
SSL |
By default, the Nutanix Prism Element server is SSL-enabled. Accordingly, the SSL flag is set to Yes by default. This indicates that the eG agent will communicate with the Prism Element server via HTTPS by default. |
|
WebPort |
By default, the Nutanix Prism Element server listens on port 9440. This implies that while monitoring a Nutanix AHV server via the Prism Element server, the eG agent connects to port 9440. |
|
Exclude VMs |
Administrators of some virtualized environments may not want to monitor some of their less-critical VMs - for instance, VM templates - both from 'outside' and from 'inside'. The eG agent in this case can be configured to completely exclude such VMs from its monitoring purview. To achieve this, provide a comma-separated list of VMs to be excluded from monitoring in the Exclude VMs text box. Instead of VMs, VM name patterns can also be provided here in a comma-separated list. For example, your Exclude VMs specification can be: *xp,*lin*,win*,vista. Here, the * (asterisk) is used to denote leading and trailing spaces (as the case may be). By default, this parameter is set to none indicating that the eG agent obtains the inside and outside views of all VMs on a virtual host by default. By providing a comma-separated list of VMs/VM name patterns in the Exclude VMs text box, you can make sure the eG agent stops collecting 'inside' and 'outside' view metrics for a configured set of VMs. |
|
Ignore VMs Inside View |
Administrators of some high security Hyper-V environments might not have permissions to internally monitor one/more VMs. The eG agent can be configured to not obtain the 'inside view' of such ‘inaccessible’ VMs using the Ignore VMs Inside View parameter. Against this parameter, you can provide a comma-separated list of VM names, or VM name patterns, for which the inside view need not be obtained. For instance, your Ignore VMs Inside View specification can be: *xp,*lin*,win*,vista. Here, the * (asterisk) is used to denote leading and trailing spaces (as the case may be). By default, this parameter is set to none indicating that the eG agent obtains the inside view of all VMs on a Hyper-V host by default. Note: While performing VM discovery, the eG agent will not discover the operating system of the VMs configured in the Ignore VMs Inside View text box. |
|
Ignore WINNT |
By default, the eG agent does not support the inside view for VMs executing on Windows NT operating systems. Accordingly, the Ignore WINNT flag is set to Yes by default. |
|
Inside View Using |
By default, this test obtains the “inside view” of VMs using the eG VM Agent. Accordingly, the Inside view using flag is set to eG VM Agent by default. The eG VM Agent is a piece of software, which should be installed on every VM on a hypervisor. Every time the eG agent runs this test, it uses the eG VM Agent to pull relevant 'inside view' metrics from each VM. Once the metrics are collected, the eG agent then communicates with each VM agent and pulls these metrics, without requiring administrator privileges. Refer to Configuring the Remote Agent to Obtain the Inside View of VMs for more details on the eG VM Agent. |
|
Domain, Admin User, and Admin Password, and Confirm Password |
By default, these parameters are set to none. This is because, by default, the eG agent collects 'inside view' metrics using the eG VM agent on each VM. Domain administrator privileges need not be granted to the eG agent if it uses this default approach to obtain the 'inside view' of Windows VMs. |
|
Report By User |
While monitoring a Nutanix AHV server, the Report By Userflag is set to No by default, indicating that by default, the guest operating systems on the AHV server are identified using the hostname specified in the operating system. On the other hand, while monitoring AHV desktop environments, this flag is set to Yes by default; this implies that in case of VDI servers, by default, the guests will be identified using the login of the user who is accessing the guest OS. In other words, in VDI environments, this test will, by default, report measures for every username_on_virtualmachinename. |
|
Report Powered OS |
This flag becomes relevant only if thereport by user flagis set to ‘Yes’. If the Report Powered OS flag is set to Yes (which is the default setting), then this test will report measures for even those VMs that do not have any users logged in currently. Such guests will be identified by their virtualmachine name and not by the username_on_virtualmachinename. On the other hand, if the Report Powered OS flag is set to No, then this test will not report measures for those VMs to which no users are logged in currently. |
|
Handles Growth Limit |
This defines the upper limit of the handles opened by any process. By default, this parameter is set to 8000. |
|
DD Frequency |
Refers to the frequency with which detailed diagnosis measures are to be generated for this test. The default is 1:1. This indicates that, by default, detailed measures will be generated every time this test runs, and also every time the test detects a problem. You can modify this frequency, if you so desire. Also, if you intend to disable the detailed diagnosis capability for this test, you can do so by specifying none against DD frequency. |
|
Detailed Diagnosis |
To make diagnosis more efficient and accurate, the eG Enterprise embeds an optional detailed diagnostic capability. With this capability, the eG agents can be configured to run detailed, more elaborate tests as and when specific problems are detected. To enable the detailed diagnosis capability of this test for a particular server, choose the On option. To disable the capability, click on the Off option. The option to selectively enable/disable the detailed diagnosis capability will be available only if the following conditions are fulfilled:
|
| Measurement | Description | Measurement Unit | Interpretation |
|---|---|---|---|
|
Handles used by processes of the VM |
Indicates the number of handles opened by various processes running in a target Windows virtual machine in the last measurement period. |
Number |
Use the detailed diagnosis of this measure to determine the top-10 processes in terms of number of handles opened. This information brings to light those processes with too many open handles. By closely tracking the handle usage of these processes over time, you can identify potential handle leaks. |
|
Processes using handles above limit in the VM |
Indicates the number of processes that have opened the handles on or above the value defined in the input parameter - HANDLES GROWTH LIMIT. |
Number |
Using the detailed diagnosis of this measure, you can accurately isolate the process(es) that has opened more handles than the permitted limit. A high value of this measure indicates that too many processes are opening handles excessively. You might want to closely observe the handle usage of these processes over time to figure out whether the spike in usage is sporadic or consistent. A consistent increase in handle usage could indicate a handle leak. |
The detailed diagnosis of the Handles used by processes measure, if enabled, lists the names of top-10 processes in terms of handle usage, the number of handles each process uses, the process ID, and the ID of the parent process.
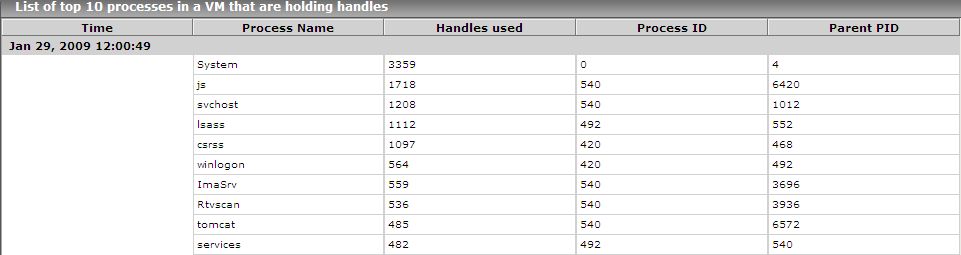
Figure 1 : The detailed diagnosis of the Handles used by processes measure
The detailed diagnosis of the Processes using handles above limit in VM measure, if enabled, lists the details of processes that are using more handles than the configured limit.

Figure 2 : The detailed diagnosis of the Processes using handles above limit in VM measure