Monitoring the Nutanix AHV Server
eG Enterprise provides a specialized model for monitoring Nutanix AHV servers with VMs that host server applications.

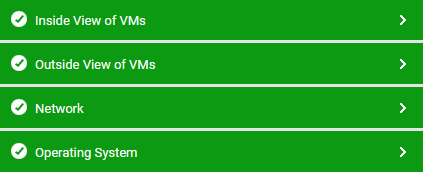
Figure 1 : Layer model of the Nutanix AHV server
Each layer of this model is mapped to tests that report on the resource usage of the hypervisor and the VMs inside-out, and point you to resource-hungry VMs and applications. Using the metrics reported by this model, administrators can find quick and accurate answers to the following performance queries:
-
Is the AHV server available over the network? If so, how responsive is the server to requests?
-
Is the content cache sized enough to handle requests, or are cache hits very low?
-
How much memory did deduplication save in the content cache?
-
Are any physical disks marked for removal? Has data from that disk been migrated?
-
Which physical disk is currently offline?
-
Is any physical disk being over-utilized?
-
Are there any latent physical disks?
-
How is the I/O performance of the physical disks?
-
Is I/O load balanced across all physical disks?
-
Is any physical disk consuming bandwidth excessively when processing I/O?
-
How is the I/O load on the storage?
-
Is the storage processing I/O requests quickly?
-
Is too much bandwidth being consumed when processing I/O?
-
Is the AHV sized with adequate storage resources? If not, what type of storage is running short of space - the SSDs? or the SATA HDDs?
-
How many VMs are operating on the AHV server? What is their IP address and which OS are they running?
-
Which VMs are currently powered off or suspended?
-
Which VMs have been newly added and which ones were recently removed from the server?
-
Which VM is the CVM of a cluster?
-
Is any VM consuming the physical CPU, memory, network, and I/O resources of the AHV server, abnormally?
-
Which VM is utilizing the CPU, memory, network, and I/O resources allocated to it, excessively? Which process on the VM is causing this abnormal resource consumption?


