Virtual Desktop Session Start-up Details Test
Figure 1 depicts a typical user logon process to a virtual desktop via XenDesktop broker.
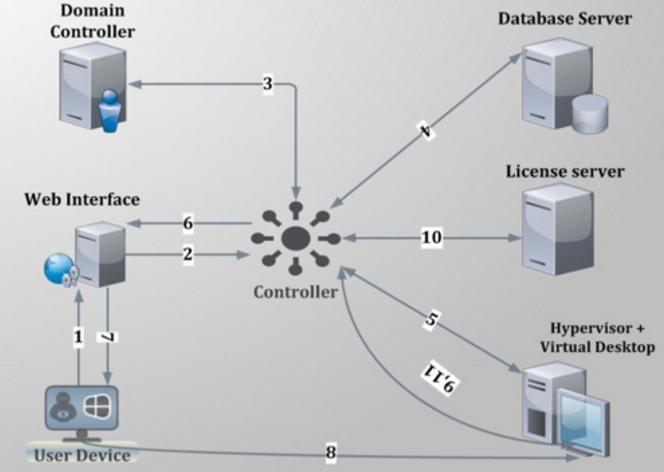
Figure 1 : Citrix user logon process
The process depicted by the above figure has been described below:
-
User provides his/her credentials to the web interface.
-
Web interface forwards the credentials to controller for verification process.
-
Delivery controller transfers these credentials to the domain controller to check if the user is present in the active directory.
-
Once it gets the successful confirmation from AD then controller communicates with site database to check what type of virtual desktop is available for current user.
-
Controller then interacts with the hypervisor layer to gather information about the availability of virtual desktop.
-
Controller then passes the ICA file for user and all the connection information is present inside ICA file so that client can establish the connection.
-
After all the process is complete, the user is assigned the virtual desktop.
-
The user then establishes a connection with the assigned virtual desktop.
-
The virtual desktop again communicates with controller for verification of licensing.
-
Controller checks for license from license server about what type of license is available for user in this current session. License server then communicates back with controller providing the licensing information.
-
Information obtained from license server is then passed to the virtual desktop.
From the discussion above, it can be inferred that login processing happens at two different places – at the delivery controller, and inside the virtual desktop. While login, authentication, and application brokering happen on the delivery controller, session creation and setup happens inside the virtual desktop. A problem in any of these places can result in a poor user experience. Inevitably, these issues result in service desk calls and complaints that “Citrix is slow.” Diagnosing login problems has traditionally been a difficult, time-consuming, manual process due to the large number of steps involved. The key to resolving user experience issues therefore, lies in tracking each user’s sessions end-to-end, ascertaining the time spent by the session at each step of the logon process – be it on the delivery controller or on the virtual desktop– and accurately identifying where and at what step of the logon process, the slowdown occurred.
To determine the time taken by the entire logon process of a user, isolate logon slowness, and understand where the process was bottlenecked – whether on the delivery controller or on the virtual desktop – use the User Logon Performance test mapped to the Citrix XA/XD Site component. If the User Logon Performance test reveals a problem in session start-up on the virtual desktop, then use the Virtual Desktop Session Start-up Details test.
With the Virtual Desktop Session Start-up Details test, administrators can receive deep visibility into the virtual desktop end of the Citrix logon process. This test takes an administrator into the virtual desktop, reveals the users who are currently logged on to the virtual desktop, and accurately reports the average time it took for the sessions of each user to start inside the virtual desktop. This way, administrators can rapidly identify which user’s sessions are experiencing undue start-up delays.
In addition, the test also provides a break-up of the session start-up duration. This way, the test precisely pinpoints where the delay occurred - when user credentials were obtained? when credentials were validated? during profile loading? during login script execution? when mapping drives or creating printers?
For this purpose, the test categorizes its metrics into client start-up metrics and server start-up metrics.
The client start-up metrics are concerned with timing the operations that occur from the point when the user requests for access to a virtual desktop to the point at which a connection to the virtual desktop is established. While connection-brokering mechanisms involve components that are not on the physical client device, the tasks these systems perform have a direct impact on the performance of the connection start-up and are recorded as part of the client-side process.
The server start-up metrics are concerned with timing the operations that occur when creating a new session on the virtual desktop. This includes user authentication, client device mapping, profile loading, login scripts execution, and finally, starting the user's desktop.
Note:
This test will report metrics for only those users who are accessing virtual desktops via a XenDesktop broker.
Target of the test :A Nutanix AHV server
Agent deploying the test : A remote agent
Outputs of the test : One set of results for every user_on_VM.
| Parameter | Description |
|---|---|
|
Test Period |
How often should the test be executed |
|
Host |
The host for which the test is to be configured. |
|
Port |
The port at which the specified host listens. By default, this is NULL |
|
Prism Element IP |
If the eG manager had discovered the target Nutanix AHV server by connecting to the Nutanix Prism Element, then the IP address of the Nutanix Prism Element server used for discovering this Nutanix AHV server would be automatically displayed against the Prism Element IP parameter; similarly, the Prism Element User and Prism Element Password text boxes will be automatically populated with the Prism Element user credentials, using which Nutanix AHV discovery was performed. If this Nutanix AHV server has not been discovered using the Nutanix Prism Element, but you still want to monitor the Nutanix AHV server via the Prism Element, then select the IP address of the Prism Element server that you wish to use for monitoring the Nutanix AHV server from the Prism Element IP list. By default, this list is populated with the IP address of all Nutanix Prism Element hosts that were added to the eG Enterprise system at the time of discovery. Upon selection, the Prism Element user and Prism Element Password that were pre-configured for that Nutanix Prism Element will be automatically displayed against the respective text boxes. On the other hand, if the IP address of the Prism Element server of interest to you is not available in the list, then, you can add the details of the Prism Element server on-the-fly, by selecting the Other option from the Prism Element IP list. This will invoke the MANAGER DISCOVERY - VIRTUAL PLATFORM SETTINGS page. Refer to the Configuring eG Enterprise to Monitor Nutanix AHV |
|
Prism Element User, Prism Element Password and Confirm Password |
If the eG manager had discovered the target Nutanix AHV server by connecting to the Nutanix Prism Element, then the IP address of the Nutanix Prism Element server used for discovering this Nutanix AHV server would be automatically displayed against thePrism Element IP parameter; similarly, the Prism Element User and Prism Element Password text boxes will be automatically populated with the Prism Element user credentials, using which Nutanix AHV discovery was performed. If this Nutanix AHV server has not been discovered using the Nutanix Prism Element, but you still want to monitor the Nutanix AHV server via the Prism Element, then select the IP address of the Prism Element server that you wish to use for monitoring the Nutanix AHV server from the Prism Element IP list. By default, this list is populated with the IP address of all Nutanix Prism Element hosts that were added to the eG Enterprise system at the time of discovery. Upon selection, the Prism Element User and Prism Element Password that were pre-configured for that Prism Element server will be automatically displayed against the respective text boxes. On the other hand, if the IP address of the Prism Element server of interest to you is not available in the list, then, you can add the details of the Prism Element server on-the-fly, by selecting the Other option from the Prism Element IP list. This will invoke the MANAGER DISCOVERY - VIRTUAL PLATFORM SETTINGS page. Refer to the Configuring eG Enterprise to Monitor Nutanix AHV |
|
SSL |
By default, the Nutanix Prism Element server is SSL-enabled. Accordingly, the SSL flag is set to Yes by default. This indicates that the eG agent will communicate with the Prism Element server via HTTPS by default. |
|
WebPort |
By default, the Nutanix Prism Element server listens on port 9440. This implies that while monitoring a Nutanix AHV server via the Prism Element server, the eG agent connects to port 9440. |
|
Exclude VMs |
Administrators of some virtualized environments may not want to monitor some of their less-critical VMs - for instance, VM templates - both from 'outside' and from 'inside'. The eG agent in this case can be configured to completely exclude such VMs from its monitoring purview. To achieve this, provide a comma-separated list of VMs to be excluded from monitoring in the Exclude VMs text box. Instead of VMs, VM name patterns can also be provided here in a comma-separated list. For example, your Exclude VMs specification can be: *xp,*lin*,win*,vista. Here, the * (asterisk) is used to denote leading and trailing spaces (as the case may be). By default, this parameter is set to none indicating that the eG agent obtains the inside and outside views of all VMs on a virtual host by default. By providing a comma-separated list of VMs/VM name patterns in the Exclude VMs text box, you can make sure the eG agent stops collecting 'inside' and 'outside' view metrics for a configured set of VMs. |
|
Ignore VMs Inside View |
Administrators of some high security Hyper-V environments might not have permissions to internally monitor one/more VMs. The eG agent can be configured to not obtain the 'inside view' of such ‘inaccessible’ VMs using the Ignore VMs Inside View parameter. Against this parameter, you can provide a comma-separated list of VM names, or VM name patterns, for which the inside view need not be obtained. For instance, your Ignore VMs Inside View specification can be: *xp,*lin*,win*,vista. Here, the * (asterisk) is used to denote leading and trailing spaces (as the case may be). By default, this parameter is set to none indicating that the eG agent obtains the inside view of all VMs on a Hyper-V host by default. Note: While performing VM discovery, the eG agent will not discover the operating system of the VMs configured in the Ignore VMs Inside View text box. |
|
Ignore WINNT |
By default, the eG agent does not support the inside view for VMs executing on Windows NT operating systems. Accordingly, the Ignore WINNT flag is set to Yes by default. |
|
Inside View Using |
By default, this test obtains the “inside view” of VMs using the eG VM Agent. Accordingly, the Inside view using flag is set to eG VM Agent by default. The eG VM Agent is a piece of software, which should be installed on every VM on a hypervisor. Every time the eG agent runs this test, it uses the eG VM Agent to pull relevant 'inside view' metrics from each VM. Once the metrics are collected, the eG agent then communicates with each VM agent and pulls these metrics, without requiring administrator privileges. Refer to Configuring the Remote Agent to Obtain the Inside View of VMs for more details on the eG VM Agent. |
|
Domain, Admin User, and Admin Password, and Confirm Password |
By default, these parameters are set to none. This is because, by default, the eG agent collects 'inside view' metrics using the eG VM agent on each VM. Domain administrator privileges need not be granted to the eG agent if it uses this default approach to obtain the 'inside view' of Windows VMs. |
|
Report By User |
While monitoring a Nutanix AHV server, the Report By Userflag is set to No by default, indicating that by default, the guest operating systems on the AHV server are identified using the hostname specified in the operating system. On the other hand, while monitoring AHV desktop environments, this flag is set to Yes by default; this implies that in case of VDI servers, by default, the guests will be identified using the login of the user who is accessing the guest OS. In other words, in VDI environments, this test will, by default, report measures for every username_on_virtualmachinename. |
|
Report Powered OS |
This flag becomes relevant only if thereport by user flagis set to ‘Yes’. If the Report Powered OS flag is set to Yes (which is the default setting), then this test will report measures for even those VMs that do not have any users logged in currently. Such guests will be identified by their virtualmachine name and not by the username_on_virtualmachinename. On the other hand, if the Report Powered OS flag is set to No, then this test will not report measures for those VMs to which no users are logged in currently. |
|
DD Frequency |
Refers to the frequency with which detailed diagnosis measures are to be generated for this test. The default is 1:1. This indicates that, by default, detailed measures will be generated every time this test runs, and also every time the test detects a problem. You can modify this frequency, if you so desire. Also, if you intend to disable the detailed diagnosis capability for this test, you can do so by specifying none against DD frequency. |
|
Detailed Diagnosis |
To make diagnosis more efficient and accurate, the eG Enterprise embeds an optional detailed diagnostic capability. With this capability, the eG agents can be configured to run detailed, more elaborate tests as and when specific problems are detected. To enable the detailed diagnosis capability of this test for a particular server, choose the On option. To disable the capability, click on the Off option. The option to selectively enable/disable the detailed diagnosis capability will be available only if the following conditions are fulfilled:
|
|
Measurement |
Description |
Measurement Unit |
Interpretation |
|---|---|---|---|
|
User sessions: |
Indicates the number of sessions currently open for this user on this virtual desktop. |
Number |
Use the detailed diagnosis of this measure to view the complete details of this user’s session. Such details includes the name and IP address of the client from which the session was launched, when session creation started, and when it ended. With the help of this information, administrators can quickly understand if the session took too long to get created. |
|
Session start-up duration: |
Indicates the time taken by this user to complete session start-up inside this virtual desktop. |
Secs |
Compare the value of this measure across users to know which user’s sessions took the longest to start on the virtual desktop. To know what is causing this ‘slowness’, compare the values reported by all the other ‘duration’ measures of this test for that user on that virtual desktop. This will quickly lead you to where that user’s session start-up is spending the maximum time. |
|
Profile load duration: |
Indicates the time taken to load this user’s profile. |
Secs |
If the user’s Session start-up duration is high, you may want to compare the value of this measure with that of the other ‘duration’ measures reported for this user to figure out if a delay in profile loading is what is really ailing that user’s logon experience with this virtual desktop. One of the common reasons for high profile load time is the large size of the user profile. |
|
Group policy processing duration: |
Indicates the time taken by this user’s session to process group policies. |
Secs |
If a user’s Session start-up duration is high, you may want to compare the value of this measure with that of the other ‘duration’ measures reported for this user to figure out if a delay in group policy processing is what is really ailing that user’s logon experience with this virtual desktop. In such a case, you can also use the detailed diagnosis of this measure to figure out the names of the group policy client-side extensions (CSE), the time each CSE took to run, the status of every CSE, and errors (if any) encountered by each CSE. Using these in-depth metrics, Citrix administrators can accurately pinpoint which CSE is impeding speedy group policy processing. Note: Detailed diagnostics will be available for this measure only if the eG VM Agent is deployed on the virtual desktops and the inside view using parameter of this test is set to eG VM Agent. Logon performance improves when fewer Group Policies are applied. Merge GPOs when possible instead of having multiple GPOs. |
|
Login script execution duration: |
Indicates the time taken for the login script to execute for this user.
|
Secs |
If a user complains of slowness, then, you can compare the value of this measure with that of the other ‘duration’ measures of that user to figure out what could have really caused the slowness. |
|
Start-up client duration: |
This is the high-level client-side connection start-up metric. It starts at the time of the request (mouse click) and ends when the connection between this user’s client device and the virtual desktop has been established. |
Secs |
When any user complains of slowness when trying to logon to a virtual desktop, you may want to compare the value of this measure with that of the Session start-up server duration measure of that user to know whether a client-side issue or a server-side issue is responsible for the slowness he/she is experiencing with that virtual desktop. If this comparison reveals that the Start-up client duration of the user is high, it indicates a client-side issue that is causing long start times. In this case therefore, compare the value of the client start-up metrics such as the Application enumeration client duration, Configuration file download client duration, Credentials obtention client duration, ICA file download client duration, Launch page web server duration, Name resolution client duration, Name resolution web server duration, Session look-up client duration, Session creation client duration, and Ticket response web server duration to know what client-side issue is causing the Start-up client duration to be high. |
|
Back-up URL client count: |
This measure is relevant when the Citrix Workspace App is the session launch mechanism. It records the number of back-up URL retries before a successful launch. Note that this is the only start-up metric that is a measure of attempts, rather than time duration. |
Number |
If this metric has a value higher than 1, it indicates that the Web Interface server is unavailable and the Citrix Workspace App is attempting to connect to back-up Web Interface servers to launch the virtual desktop. A value of 2 means that the main Web Interface server was unavailable, but the Citrix Workspace App managed to launch the virtual desktop successfully using the first back-up server that it tried. A value higher than 2 means that multiple Web Interface servers are unavailable. Probable reasons for the non-availability of the Web Interface servers include (in order of likelihood):
|
|
Application enumeration client duration: |
This measure is relevant when the Citrix Workspace App is the session launch mechanism. It measures the time needed by this user’s session to retrieve the list of applications from the Web Interface service. |
Secs |
If the Start-up client duration measure reports a high value for a user, then compare the value of this measure with that of the other client-side metrics such as Configuration file download client duration, Credentials obtention client duration, ICA file download client duration, Launch page web server duration, Name resolution client duration, Name resolution web server duration, Session look-up client duration, Session creation client duration, and Ticket response web server duration to know whether/not slowness in application enumeration is the precise reason why it took the user a long time to establish a session with the virtual desktop. |
|
Configuration file download client duration: |
This measure is relevant when the Citrix Workspace App is the session launch mechanism. It measures the time this user’s session took to retrieve the configuration file from the XML broker. |
Secs |
If the Start-up client duration measure reports a high value for a user, then compare the value of this measure with that of the other client-side metrics such as Application enumeration client duration, Credentials obtention client duration, ICA file download client duration, Launch page web server duration, Name resolution client duration, Name resolution web server duration, Session look-up client duration, Session creation client duration, and Ticket response web server duration to know whether/not slowness in retrieving the configuration file from the XML server is the precise reason why it took the user a long time an ICA session with the XenApp server. |
|
Credentials obtention client duration: |
This measure is relevant when the Citrix Workspace App is the session launch mechanism. It measures the time required by this user’s session to obtain the user credentials. |
|
Note that COCD is only measured when the credentials are entered manually by the user. Because this metric may be artificially inflated if a user fails to provide credentials in a timely manner, it is subtracted from the Start-up client duration. However, in the event that the user manually inputs the credentials, and the value of this measure is higher than that of all the other client start-up metrics that this test reports, it is a clear indicator that any connection delay that the user may have experienced is owing to slowness in obtaining user credentials. |
|
ICA file download duration: |
This measure is relevant when the Citrix Workspace App is the session launch mechanism. This is the time it takes for this user’s client to download the ICA file from the web server. |
Secs |
The overall process here is:
This measure represents the time it takes for the complete process (step 1 to 6). The measure stops counting time when the client receives the ICA file data. The Launch page web server duration measure on the other hand, covers the Web server portion of the process (that is, steps 3 and 4). If the ICA file download duration is high, but the Launch page web server duration is normal, it implies that the server-side processing of the launch was successful, but there were communication issues between the client device and the Web server. Often, this results from network trouble between the two machines, so investigate potential network issues first. |
|
Launch page web server duration: |
This measure is relevant when the Web Interface is the session launch mechanism. It measures the time needed by this user’s session to process the launch page (launch. aspx) on the Web Interface server. |
Secs |
If the value of this measure is high, it indicates at a bottleneck on the Web Interface server. Possible causes include:
|
|
Name resolution client duration: |
This is the time it takes the XML service to resolve the name of a published application to an IP address. |
Secs |
This metric is collected when a client device directly queries the XML Broker to retrieve published application information stored in IMA. This measure is only gathered for new sessions since session sharing occurs during startup if a session already exists. When this metric is high, it indicates the XML Broker is taking a lot of time to resolve the name of a published application to an IP address. Possible causes include a problem on the client, issues with the XML Broker, such as the XML Broker being overloaded, a problem with the network link between the two, or a problem in IMA. Begin by evaluating traffic on the network and the XML Broker. |
|
Name resolution web server duration: |
This measure is relevant when the Citrix Workspace App is the session launch mechanism. It is the time it takes the XML service to resolve the name of this virtual desktop to its IP address. |
Secs |
When this metric is high, there could be an issue with the Web Interface server or the Citrix Workspace App, the XML Service, the network link between the two, or a problem in IMA. Like the Name resolution client duration measure, this metric indicates how long it takes the XML service to resolve the name of a virtual desktop to its IP address. However, this metric is collected when a Web Interface site is performing this process on behalf of a launch request it has received from either the Citrix Workspace App or from a user clicking a Web Interface page icon. |
|
Session look-up client duration: |
Indicates the time this user’s session takes to query every ICA session to host the requested published application. |
MSecs |
The check is performed on the client to determine whether the application launch request can be handled by an existing session. A different method is used depending on whether the session is new or shared. |
|
Session creation client duration: |
Indicates the new session creation time. |
Secs |
In the event of slowness, if the Start-up client duration of a user session is found to be higher than the Session start-up server duration, you may want to compare the value of this measure with all other client start-up measures to determine whether/not session creation is the process that is slowing down the application launch. |
|
Ticket response web server duration: |
This measure is relevant when the Citrix Workspace App or Web Interface is the desktop launch mechanism. This is the time this user’s sessions take to get a ticket (if required) from the STA server or XML service. |
Secs |
When this metric is high, it can indicate that the Secure Ticket Authority (STA) server or the XML Broker are overloaded. |
|
Reconnect enumeration client duration: |
This measure is relevant when the Citrix Workspace App or Web Interface is the desktop launch mechanism. This is the time it takes this user’s client to get a list of reconnections. |
Secs |
Compare the value of this measure with that of other client start-up metrics for a user to know what is the actual cause for the client start-up delay. |
|
Reconnect enumeration web server duration: |
This measure is relevant when the Citrix Workspace App or Web Interface is the desktop launch mechanism. This is the time it takes the Web Interface to get the list of reconnections for this user from the XML service. |
Secs |
Compare the value of this measure with that of other client start-up metrics for a user to know what is the actual cause for the client start-up delay. |
|
Session start-up server duration: |
This is the high-level server-side connection start-up metric. It includes the time spent on this virtual desktop to perform the entire start-up operation. |
Secs |
When this metric is high, it indicates that there is a server-side issue increasing session start times. To zero-in on this issue, compare the values of the server start-up metrics such as Session creation server duration, Credentials obtention server duration, Program neighbourhood credentials obtention server duration, Credentials obtention network server duration, Credentials authentication server duration, Profile load server duration, Login script execution server duration, Drive mapping server duration, Drive mapping server duration, and Printer creation server duration. |
|
Session creation server duration: |
Indicates the time spent by this virtual desktop in creating the session for this user. |
Secs |
This duration starts when the ICA client connection has been opened and ends when authentication begins. This should not be confused with ‘Session start-up server duration’. |
|
Credentials obtention server duration: |
Indicates the time taken by this virtual desktop to obtain the credentials of this user. |
Secs |
This time is only likely to be a significant if manual login is being used and the server-side credentials dialog is displayed (or if a legal notice is displayed before login commences). Because this metric may be artificially inflated if a user fails to provide credentials in a timely manner, it is not included in the Session start-up server duration. However, in the event that the user manually inputs the credentials, and the value of this measure is higher than that of all the other client start-up metrics that this test reports, it is a clear indicator that any connection delay that the user may have experienced is owing to slowness in obtaining user credentials. |
|
Credentials obtentions network server duration: |
Indicates the time spent by this virtual desktop performing network operations to obtain credentials for this user. |
Secs |
This only applies to a Security Support Provider Interface login (a form of pass-through authentication where the client device is a member of the same domain as the server and Kerberos tickets are passed in place of manually entered credentials). |
|
Program neighbourhood credentials obtention server duration: |
Indicates the time needed for this virtual desktop to cause the Program Neighborhood instance running on the client (“Program Neighborhood Classic”) to obtain this user’s credentials. |
Secs |
As in the case of the Credentials obtention server duration metric, because this metric may be artificially inflated if a user fails to provide credentials in a timely manner, it is not included in the Session start-up server duration. |
|
Credentials authentication server duration: |
Indicates the time spent by this virtual desktop when authenticating the user’s credentials against the authentication provider, which may be Kerberos, Active Directory® or a Security Support Provider Interface (SSPI). |
Secs |
Where server-side issues are causing user experience to deteriorate, you can compare the value of this measure with that of all the other server start-up metrics that this test reports – i.e., Session creation server duration, Credentials obtention server duration, Program neighbourhood credentials obtention server duration, Credentials obtention network server duration, Profile load server duration, Login script execution server duration, Drive mapping server duration, Drive mapping server duration, and Printer creation server duration – to know what is the root-cause of delays in server start-up. |
|
Profile load server duration: |
Indicates the time required by this virtual desktop to load this user’s profile. |
Secs |
If this metric is high, consider your Terminal Services profile configuration. Citrix Consulting has found that when customers have logon times greater than 20 seconds, in most cases, this can be attributed to poor profile and policy design. Roaming profile size and location contribute to slow session starts. When a user logs onto a session where Terminal Services roaming profiles and home folders are enabled, the roaming profile contents and access to that folder are mapped during logon, which takes additional resources. In some cases, this can consume significant amounts of the CPU usage. Consider using the Terminal Services home folders with redirected personal folders to mitigate this problem. In general, consider using Citrix Profile management to manage user profiles in Citrix environments. This tool also provides logging capabilities to help isolate profile issues. If you are using Citrix profile management and have slow logon times, check to see if your antivirus software is blocking the Citrix profile management tool. |
|
Login script execution server duration: |
Indicates the time needed by this virtual desktop to run this user’s login script(s). |
Secs |
If the value of this measure is abnormally high for any user, consider if you can streamline this user or group's login scripts. Also, consider if you can optimize any application compatibility scripts or use environment variables instead. |
|
Drive mapping server duration: |
Indicates the time needed for this virtual desktop to map this user’s client drives, devices and ports. |
Secs |
Make sure that, when possible, your base policies include settings to disable unused virtual channels, such as audio or COM port mapping, to optimize the ICA protocol and improve overall session performance. |
|
Printer creation server duration: |
Indicates the time required for this virtual desktop to synchronously map this user’s client printers. |
Secs |
If the configuration is set such that printer creation is performed asynchronously, no value is recorded for this measure as it is does not impact completion of the session start-up. On the other hand, if excessive time is spent mapping printers, it is often the result of the printer autocreation policy settings. The number of printers added locally on the users' client devices and your printing configuration can directly affect your session start times. When a session starts, the virtual desktop has to create every locally mapped printer on the client device. Consider reconfiguring your printing policies to reduce the number of printers that get created - especially if users have a lot of local printers. |
As stated earlier, by default, clicking on the Inside View of Virtual Desktops layer, leads you to a page displaying the current status of the individual desktops that have been configured on the Nutanix AHV server. If you want to override this default setting - i.e., if you prefer to view the tests mapped to the Inside View of Virtual Desktopslayer first, and then proceed to focus on individual desktop performance, follow the steps given below:
-
Edit the eg_ui.ini file in the <eg_install_dir>\manager\config directory
-
Set the LAYERMODEL_LINK_TO_VIRTUAL flag in the file to false; this is set to true by default.
-
Save the eg_ui.ini file.
Doing so ensures that as soon as the Inside View of Virtual Desktops layer is clicked, the list of tests mapped to that layer appears. If you now want the Desktop view of Figure 1, simply click on Back button in the layer model page.
From the desktop view, you can further drill-down to focus on the health of a particular desktop, by clicking on the icon representing the desktop in Figure 1. Figure 2 then appears displaying all the performance metrics extracted from that virtual desktop in real-time. You are thus enabled to cross-correlate across the various metrics, and quickly detect the root-cause of current/probable disturbances to the internal health of a desktop. To view the time-of-day variations in a measure, you can view its graph by clicking on that measure in Figure 2.
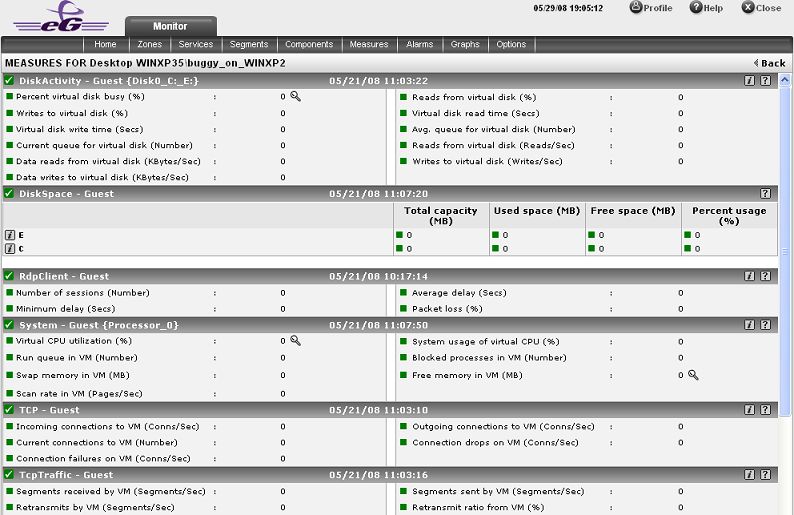
Figure 2 : The measures pertaining to a particular desktop
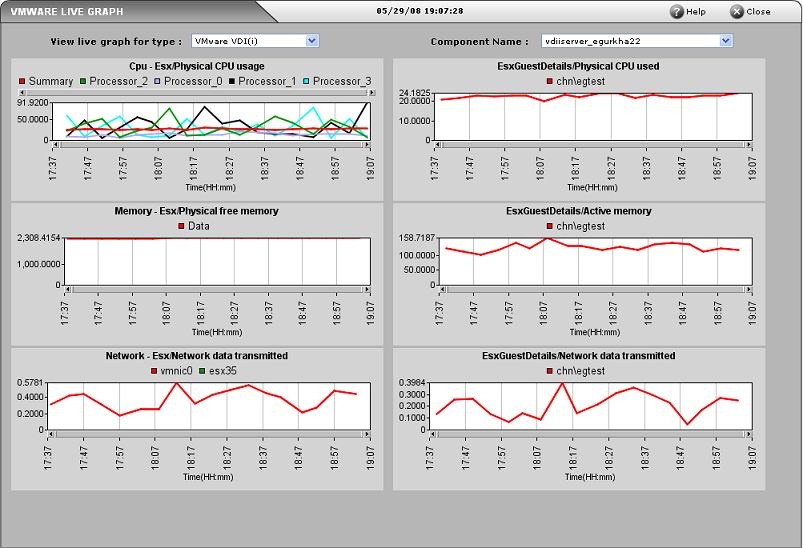
You can also view live graphs of pre-configured measures pertaining to an AHV server and the virtual desktops configured on it, by clicking on the live graphs link in Figure 1. Alternatively, you can click on the  icon that appears in the Tests panel of the layer model page when the Virtual Desktop layer (see Figure 2) is clicked to view the live graph. The resulting graph display (see Figure 3) has been organized in such a way that next to every host-pertinent measure graph, the closely related guest-specific measure graph appears. This way, you can easily compare and correlate how well the physical CPU resources are being utilized by both the host and the guests. On the basis of this analysis, you can proactively isolate potential performance issues, and also determine the root-cause of the issue - is it the AHV hypervisor? or is it the virtual guest? If you access this page from the LIVE GRAPH link in Figure 1, then, by default, you will view live graphs pertaining to the VDI server. However, you can select a different virtualized component-type and a different virtualized component using the type and Component lists (respectively) in Figure 3.