
Nutanix Clusters Test
Nutanix software runs as a virtual machine (VM) on industry-standard hypervisors, including VMware vSphere and Microsoft Hyper-V, as well as Nutanix’s built-in AHV virtualization technology (based on KVM). Servers running Nutanix software are clustered together in one or more clusters. The Nutanix software aggregates the local data storage resources on each node and forms a distributed storage fabric that is presented back to the hypervisor as NFS, SMB3 or iSCSI depending on the hypervisor deployed. A global data system architecture integrates each new node into the cluster, allowing you to scale the solution to meet the needs of your infrastructure.
To ascertain the needs of the infrastructure and to determine whether/not additional nodes need to be added to the cluster, Nutanix administrators should:
-
Monitor each cluster and determine its composition and configuration;
-
Study how each cluster is utilizing the pooled compute and storage resources;
This visibility is provided by the Nutanix Clusters test. This test auto-discovers the clusters managed by the monitored Nutanix Prism Element, and reports the following for each cluster:
-
The number and names of VMs and hypervisors managed by each cluster;
-
The total compute and storage capacity of every cluster:
-
How every cluster is using the available capacity;
-
The I/O load on each cluster;
-
How each cluster is handling the I/O load;
In the process, the test pinpoints those clusters that many not have the storage and processing power to handle their current and anticipated load, and are hence candidates for expansion.
Target of the test : A Nutanix AHV Prism Element
Agent deploying the test : A remote agent
Outputs of the test : One set of results for every cluster managed by the Nutanix AHV Prism Element. If the Prism Element is being monitored, then this test will report metrics only for a single cluster. If the Prism Central is being monitored, then this test will reports metrics for multiple clusters.
| Parameter | Description |
|---|---|
|
Test Period |
How often should the test be executed |
|
Host |
The host for which the test is to be configured. |
|
Port |
The port at which the specified host listens. By default, this is NULL |
|
Nutanix Prism Element User, Nutanix Prism Element Password and Confirm Password |
To connect to the Nutanix Prism Element and collect metrics from it, the eG agent should be configured with the credentials of a Prism Element user with the Viewer role. The steps for creating such a user are detailed in the Pre-requisites for Monitoring Nutanix Prism Element topic. Confirm the nutanix Prism Element password by retyping itin Confirm Password textbox. |
|
SSL |
By default, the Nutanix Prism Element server is SSL-enabled. Accordingly, the SSL flag is set to Yes by default. This indicates that the eG agent will communicate with the Prism Element server via HTTPS by default. |
|
WebPort |
By default, the Nutanix Prism server listens on port 9440. This implies that while monitoring a Nutanix AHV server via the Prism server, the eG agent connects to port 9440. |
|
DD Frequency |
Refers to the frequency with which detailed diagnosis measures are to be generated for this test. The default is 1:1. This indicates that, by default, detailed measures will be generated every time this test runs, and also every time the test detects a problem. You can modify this frequency, if you so desire. Also, if you intend to disable the detailed diagnosis capability for this test, you can do so by specifying none against DD frequency. |
|
Detailed Diagnosis |
To make diagnosis more efficient and accurate, the eG Enterprise embeds an optional detailed diagnostic capability. With this capability, the eG agents can be configured to run detailed, more elaborate tests as and when specific problems are detected. To enable the detailed diagnosis capability of this test for a particular server, choose the On option. To disable the capability, click on the Off option. The option to selectively enable/disable the detailed diagnosis capability will be available only if the following conditions are fulfilled:
|
| Measurement | Description | Measurement Unit | Interpretation | ||||||
|---|---|---|---|---|---|---|---|---|---|
|
Is it a cloud cluster? |
Indicates whether/not this cluster is deployed on the cloud. |
|
The values that this measure can report and their corresponding numeric values are detailed in the table below:
By default, this measure reports the Measure Values listed in the table above to indicate whether/not the cluster is on the cloud. In the graph of this measure however, the same is represented using the numeric equivalents only. |
||||||
|
Are shadow clones enabled? |
Indicates whether/not shadow clones are enabled for this cluster. |
|
Shadow Clones significantly improve performance by caching virtual machine data across a Nutanix cluster. Unique to Nutanix, Shadow Clones benefit scenarios where there are multiple VMs reading a single source of data, such as deployment servers and repositories. VDI deployments, where many linked clones forward read requests to a central master (e.g., Citrix MCS Master VM or VMware View replica disks), are an ideal example. With Shadow Clones, Nutanix actively monitors vDisk access trends. If there are requests originating from more than two remote Controller VMs (CVMs), as well as the local CVM, and all of the requests are read I/O, the vDisk will be marked as immutable. Once the disk has been marked immutable, the vDisk is then cached locally by each CVM so read operations are now satisfied locally by direct-attached storage resources. Shadow clones are enabled by default, and can be disabled if required. If shadow clones are enabledfor this cluster, then this measure will report the value Yes. If they are disabled, then this measure will report the value No. The numeric values that correspond to these measure values are as follows:
By default, this measure reports the Measure Values listed in the table above to indicate whether/not shadow clones are enabled for this cluster. In the graph of this measure however, the same is represented using the numeric equivalents only. |
||||||
|
Is lockdown mode enabled? |
Indicates whether/not the lockdown mode has been enabled for this cluster. |
|
Cluster lockdown is the ability to disable password based CVM access and/or only allow key based access. The values that this measure can report and their corresponding numeric values are listed in the table below:
By default, this measure reports the Measure Values listed in the table above to indicate whether/not lockdown mode is enabled. In the graph of this measure however, the same is represented using the numeric equivalents only. |
||||||
|
Host hypervisors in the cluster |
Indicates the number of hypervisors in this cluster. |
Number |
Use the detailed diagnosis of this measure to know which hypervisors have been added to which cluster. The name, IP address, and type of hypervisor is provided as part of the detailed metrics. |
||||||
|
Total CPU capacity |
Indicates the total CPU capacity of this cluster. |
GHz |
|
||||||
|
CPU used |
Indicates the amount of CPU used by this cluster currently. |
GHz |
Ideally, the value of this measure should be low. |
||||||
|
Available CPU |
Indicates the amount of CPU that is currently unused by this cluster. |
GHz |
Ideally, the value of this measure should be high. |
||||||
|
CPU utilization |
Indicates the percentage of CPU utilized by this cluster. |
Percent |
A value close to 100% indicates excessive utilization of CPU by the cluster, and points to a potential CPU contention on the cluster. If the consumption increases consistently, you may want to add more nodes to the cluster to ensure that more CPU resources are available to it. Compare the value of this measure across clusters to know which cluster is consuming the maximum CPU. |
||||||
|
Available CPU |
Indicates the percentage of CPU unused by this cluster. |
Percent |
If the value of this measure slides steadily, it is a cause for concern, as it indicates that CPU resources are being over-consumed by the cluster. If the problem persists, you may want to add more nodes to the cluster to ensure that more CPU resources are available to it. |
||||||
|
Total IOPS |
Indicates the total number of I/O operations on this cluster. |
Number |
This is a good indicator of the level of I/O activity on a cluster. A consistent increase in the value of this measure for a cluster could indicate a probable I/O overload on that cluster. In such situations, you may want to compare the value of the Read IOPS and Write IOPS measures of the cluster to know what type of IO operations are contributing to the overload. |
||||||
|
Read IOPS |
Indicates the number of read I/O operations performed currently on this cluster. |
Number |
If the value of the Total IOPS measure is unusually high, then compare the value of these measures for that cluster to know what is contributing to the unusual I/O activity levels - read requests? or write requests? |
||||||
|
Write IOPS |
Indicates the number of write I/O operations performed currently on this cluster. |
Number |
|||||||
|
Total I/O latency |
Indicates the average time taken by the physical disks in this cluster to process I/O requests . |
Secs |
Ideally, the value of this measure should be very low. A high value or a steady increase in this value could indicate an I/O processing bottleneck on this cluster. In such a case, compare the value of the Read IO latency and Write IO latency measures to figure out when the slowness is worst - when processing read requests? or write requests? |
||||||
|
Read IO latency |
Indicates the average time taken by the physical disks in this cluster to process read I/O requests. |
Secs |
If the Total I/O latency measure reports an abnormally high value, then compare the value of these measures to figure out where the slowness is maximum - when processing read requests? or write requests?
|
||||||
|
Write IO latency |
Indicates the average time taken by the physical disks in this cluster to process write I/O requests. |
Secs |
|||||||
|
Total IO bandwidth |
Indicates the bandwidth per second used by the physical disks in this cluster when processing I/O requests. |
KB/Sec |
A high value for this measure denotes that the cluster is processing bandwidth-intensive I/O. In such situations, you may want to compare the value of the Read IO bandwidth and Write IO bandwidth mmeasures to know what type of I/O requests are truly contributing to the excessive bandwidth consumptions - read requests? or write requests? |
||||||
|
Read IO bandwidth |
Indicates the bandwidth per second used by this clusterwhen processing read I/O requests. |
KB/Sec |
If the value of the Total IO bandwidth measure is high, then you may want to compare the value of the Read IO bandwidth and Write IO bandwidth measures to know what type of I/O requests are truly contributing to the excessive bandwidth consumption - read requests? or write requests?
|
||||||
|
Write IO bandwidth |
Indicates the bandwidth per second used by this cluster when processing write I/O requests. |
GB |
|||||||
|
Read IO |
Indicates the amount of data read from this cluster in response to read I/O requests. |
KB |
These measures are good indicators of the workload on the cluster. |
||||||
|
Write IO |
Indicates the amount of data written to this cluster in response to write I/O requests. |
KB |
|||||||
|
Total memory capacity |
Indicates the total memory capacity of this cluster. |
GB |
|
||||||
|
Memory used |
Indicates the amount of memory that is currently in use in this cluster. |
GB |
Ideally, the value of this measure should be low. |
||||||
|
Available memory |
Indicates the amount of memory that is unused in this cluster. |
GB |
Ideally, the value of this measure should be high. |
||||||
|
Memory utilization |
Indicates the percentage of memory capacity currently being used in this cluster. |
Percent |
A value close to 100% indicates excessive memory usage by the cluster. If the high memory usage condition persists, you may want to consider adding more nodes to the cluster to increase its memory capacity. If memory capacity is not expanded, then the cluster will soon exhaust its memory resources, putting the health of both the hypervisors and VMs in the cluster at peril. |
||||||
|
Available memory |
Indicates the percentage of memory capacity that is currently unused by this cluster. |
Percent |
If the value of this measure slides consistently, it could mean that the cluster's memory resources are being rapidly depleted. If the condition persists, then the cluster will soon exhaust its memory resources, putting the health of both the hypervisors and VMs in the cluster at peril. Under such circumstances, you may want to consider adding more nodes to the cluster to increase its memory capacity. |
||||||
|
Total storage capacity |
Indicates the total storage capacity of this cluster. |
GB |
|
||||||
|
Storage used |
Indicates the amount of storage space that is currently being used by this cluster. |
GB |
Ideally, the value of this measure should be low. |
||||||
|
Available storage |
Indicates the amount of storage space that is currently available for the use of this cluster. |
GB |
Ideally, the value of this measure should be high. |
||||||
|
Storage utilization |
Indicates the percentage of storage capacity that is currently utilized by this cluster. |
Percent |
A value close to 100% indicates excessive space usage by the cluster. If the high space usage condition persists, you may want to consider adding more nodes to the cluster to increase its memory capacity. If storage capacity is not expanded, then the cluster will soon exhaust its available storage resources, putting the health of both the hypervisors and VMs in the cluster at peril. |
||||||
|
Available storage |
Indicates the percentage of storage capacity that unused in the cluster. |
Percent |
If the value of this measure slides consistently, it could mean that the cluster's storage resources are being rapidly depleted. If the condition persists, then the cluster will soon exhaust its storage resources, putting the health of both the hypervisors and VMs in the cluster at peril. Under such circumstances, you may want to consider adding more nodes to the cluster to increase its storage capacity. |
||||||
|
Total VMs |
Indicates the total number of VMs in this cluster. |
Number |
Use the detailed diagnosis of this measure to know the names, IP address, and operating system of the VMs in the cluster. |
||||||
|
Powered on VMs |
Indicates the number of VMs in this cluster that are currently powered on. |
Number |
|
||||||
|
Powered off VMs |
Indicates the number of VMs in this cluster that are currently powered off. |
Number |
|
||||||
|
Controller VMs |
Indicates the number of CVMs in this cluster. |
Number |
The detailed diagnosis of this measure lists the name, IP address, and operating system of the CVMs, and which hypervisor each CVM runs on. |
Use the detailed diagnosis of the Host hypervisors in cluster measure to know which hypervisors have been added to which cluster. The name, IP address, and type of hypervisor is provided as part of the detailed metrics.
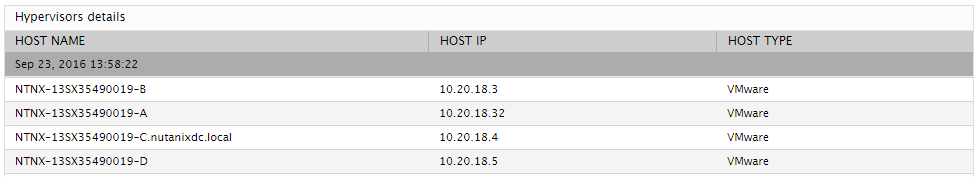
Figure 1 : The detailed diagnosis of the Host hypervisors in cluster measure
Use the detailed diagnosis of the Total VMs measure to know the names, IP address, and operating system of the VMs in the cluster.
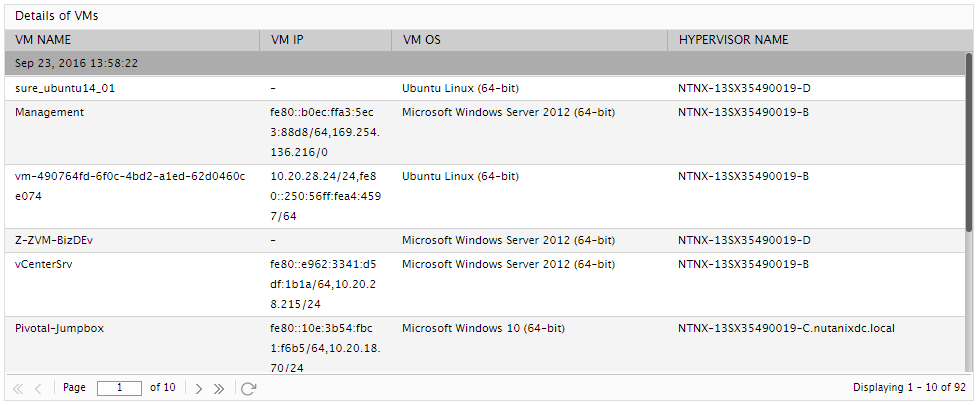
Figure 2 : The detailed diagnosis of the Total VMs measure
The detailed diagnosis of the Controller VMs measure lists the name, IP address, and operating system of the CVMs, and which hypervisor each CVM runs on.
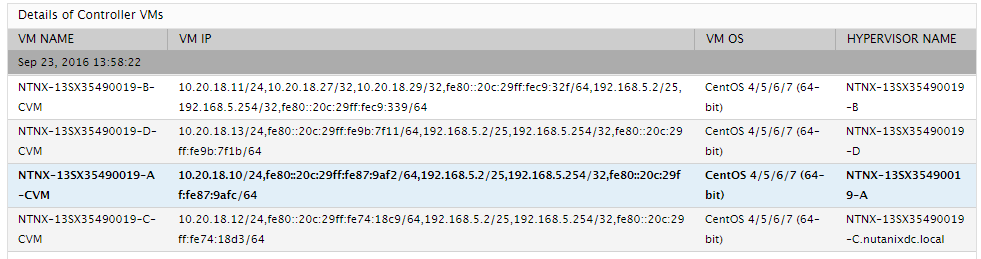
Figure 3 : The detailed diagnosis of the Controller VMs measure
