All Events Dashboard
The All Events dashboard provides you with a consolidated list of performance issues that are still to be resolved across the Office 365 environment and services that a chosen tenant has subscribed to.
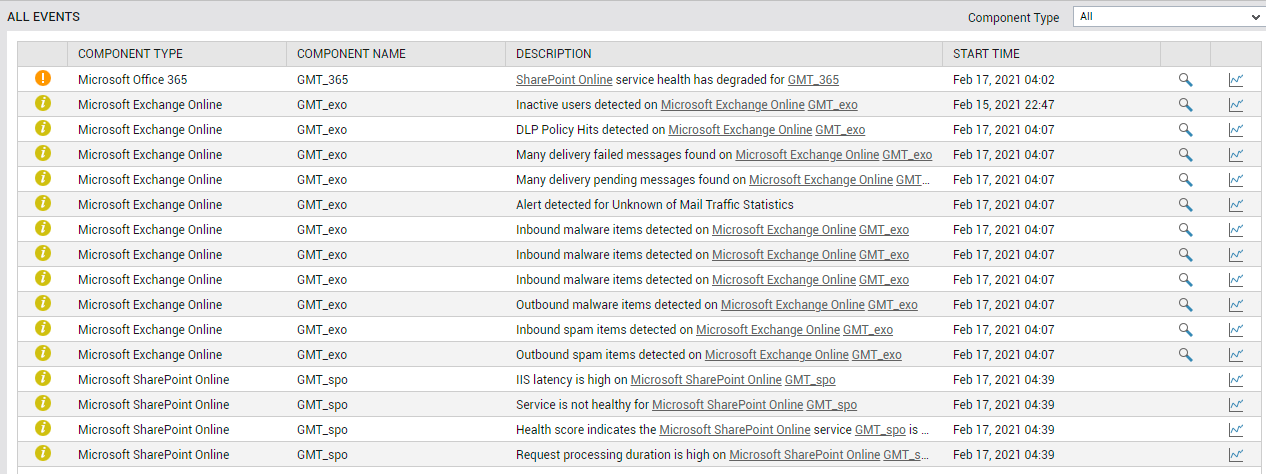
Figure 1 : The ALL EVENTS dashboard
To access the dashboard, click on the Monitor tile and select Microsoft Office 365 from the Dashboards menu. Then, move your mouse pointer over the All Events icon in the left panel of the page that appears, and click All Events.
To view this dashboard for a particular tenant, choose that tenant from the Tenant list box at the right, top corner.
By default, the dashboard lists all the open eG alerts across all the O365 component types that have been managed for a chosen tenant. If needed, you can view only those alerts that are related to a particular O365 component type by selecting that type from the Component Type list in this dashboard.
Each problem event displayed in this dashboard indicates:
- The problem severity (Critical/Major/Minor) - this is indicated using conventional color codes and intuitive icons.
- The problem component
- The problem component type
- A brief description of the problem
- The problem start time
You can also view detailed diagnostics (if available) related to a problem event by clicking on the magnifying glass icon alongside.
To historically analyze a problem event, click on the graph icon alongside the event.