Monitoring Oracle Database Server
Figure 1 depicts the layer model that the eG Enterprise uses to monitor an Oracle database server. The Operating System and Tcp layers have been already discussed in the earlier chapters. The Oracle Processes layer tracks the status of the individual Oracle processes that support a specific database instance. Above the Application Processes layer is the SQL Network layer. This layer provides information about the traffic flowing into and out of the database instance. As indicated above, to handle incoming requests, an Oracle database server uses logical memory structures that interact with the underlying physical structures to form the database. The Memory Structures layer in Figure 1 tracks the health of the Oracle server’s memory structures. The memory structures of an Oracle database server include:
- The System Global Area (SGA), which is an area of memory that is designed to execute processes to obtain data for user queries as quickly as possible while also maximizing the number of concurrent users that can access the Oracle instance.
- Locks, which are synchronization mechanisms that prevent destructive interactions between transactions accessing the same resource (e.g., user objects such as tables, or system objects such as shared data structures in memory and data dictionary rows).
- Rollback segments, which represent an area where the before change image of the data is stored for undo purposes. The rollback data can be system rollback data or non-system rollback data.
-
Above the Memory Structures layer, the eG Enterprise monitors the storage resources used by the database server. Tablespaces are logical storage resources used for storing tables, indexes, rollback segments, and the data dictionary. A tablespace can belong to one database instance only, and represents the place where the data is actually stored in the database. The Tablespaces layer in Figure 1 monitors the status of the different tablespaces used by a database server. A tablespace stores the data on disk in the form of one or more datafiles. The Datafiles layer of Figure 1 captures the health of the datafiles that form a major proportion of any database. These files contain user’s data, Oracle’s data dictionary and also include tables, indexes and clusters. Above the Datafiles layer, the Oracle Service layer tracks the overall health of the service offered by the Oracle database instance.
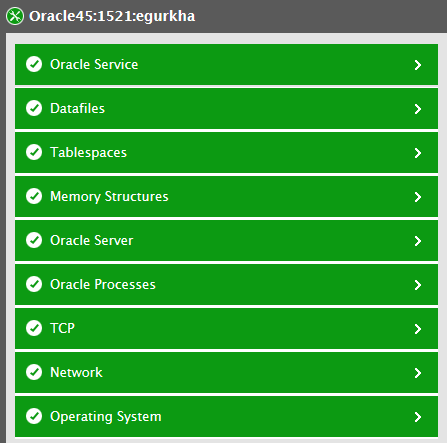
Figure 1 : Layer model for Oracle database servers
Each of the layers in Figure 1 above is mapped to a wide variety of tests, which collect a wealth of performance data from the Oracle database. Using this data, the following questions can be answered:
|
Database service monitoring |
|
|
Session monitoring |
|
|
Query monitoring |
|
|
Transaction monitoring |
|
|
Alert log monitoring |
|
|
Rollback segment monitoring |
|
|
Lock and latch monitoring |
|
|
Cache monitoring |
|
|
Full table scan monitoring |
|
|
Tablespace monitoring |
|
|
Hot file monitoring |
|
|
Redo log monitoring |
|
|
Object monitoring |
|