Monitoring Oracle Exadata Storage Server
eG Enterprise offers a special-purpose monitoring model for Oracle Exadata Storage Server to monitor the status of the storage cell, I/O processing capability of the cell disks, flash cache and physical disks. This way, administrators are proactively alerted to probable performance dips that the storage system suffers.
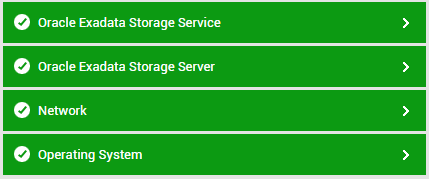
Figure 1 : Layer model for Oracle Exadata Storage Server
Every layer in the Figure 1 is mapped to various tests to determine the critical statistics related to the performance of the target storage server. Using the metrics reported by the tests, administrators can find accurate answers for the following performance queries:
- What is the current status of the target storage cell?
- What is the status of the software components such as cell server, management server and restart server available on the target server/storage cell?
- What is the current temperature status of the storage cell?
- Was the storage cell restarted recently?
- How well physical and virtual memory resources were utilized by the cell servr and management server?
- What is the current temperature of the storage cell?
- How many critical/informational/warning alerts were generated on the target server?
- How well data was transmitted through/received from infiniband interfaces?
- How well data was transmitted through/received from ethernet interfaces?
- How well data is read from and written to each cell disk?
- How many errors were noticed on each cell disk? Which cell disk is more prone to errors?
- What is the average latency of each cell disk to read/write large blocks and small blocks?
- What percent of disk resources were utilized to process large read requests and small requests for each cell disk?
- How well data was transmitted through/received from each host interconnect connecting the database server and the storage cell?
- Which host interconnect experienced data drops frequently during RDMA transmission?
- What is the space utilization of each flash cache?
- How well each flash cache services read/write I/O requests?
- How many read/write requests bypassed the flash cache?
- What is the rate at which data was read directly from the disks bypassing the flash cache?
- How many read/write requests bypassed the flash cache due to heavy load on the flash cache?
- What is the current status of each cell disk?
- How well each cell disk is utilizing the allotted space? Which cell disk is running out of space?
- What is the current status of each flash cache?
- How many cell disks are currently allocated to each flash disk?
- How many cell disks allocated to each flash cache are currently unavailable?
- What is the space utilization of each flash cache? Which flash cache is currently running out of space?
- What is the current status of each flash log?
- How many cell disks are currently allocated to each flash log?
- How many cell disks allocated to each flash log are currently unavailable?
- What is the space utilization of each flash log? Which flash log is currently running out of space?
- What is the current status of each grid disk?
- How many errors were encountered by each grid disk? Which grid disk is frequently prone to errors?
- What is the current status of each physical disk?
- How many LUNs were provisioned using each physical disk?
Since the tests mapped to the Network Layer are elaborately discussed in Monitoring Cisco Router document, the sections to come will discuss the other layers in detail.