LDoms Primary Domain Test
This test monitors the resource usage of the control domain (also referred to as the primary domain) of a Oracle LDoms server. The test reports the CPU and memory resources used by processes running in the primary domain. Using this test, administrators can determine whether any resource consuming processes are running in the primary domain.
Target of the test : A Oracle LDoms server
Agent deploying the test : An internal agent
Outputs of the test : One set of results for each processor supported by the primary domain on the Oracle LDoms host.
| Parameter | Description |
|---|---|
|
Test period |
How often should the test be executed |
|
Host |
The host for which the test is to be configured. |
|
Duration |
Determines the period (in seconds) for which the test runs each time. |
|
Summary |
This attribute is applicable to multi-processor systems only. If the Yes option is selected, then the eG agent will report not only the CPU and memory utilization of each of the processors, but it will also report the summary (i.e., average) of the CPU and memory utilizations of the different processors. If the No option is selected, then the eG agent will report only the CPU usage of the individual processors. |
|
UseIOStat |
By default, the UseIOStat flag is set to No. This indicates that, by default, this test reports the CPU utilization of every processor on the system being monitored, and also provides the average CPU utilization across the processors. However, if you want the test to report only the average CPU utilization across processors and across user sessions, then set the UseIOStat flag to Yes. In such a case, the processor-wise breakup of CPU utilization will not be available. |
|
Detailed Diagnosis |
To make diagnosis more efficient and accurate, the eG Enterprise embeds an optional detailed diagnostic capability. With this capability, the eG agents can be configured to run detailed, more elaborate tests as and when specific problems are detected. To enable the detailed diagnosis capability of this test for a particular server, choose the On option. To disable the capability, click on the Off option. The option to selectively enable/disable the detailed diagnosis capability will be available only if the following conditions are fulfilled:
|
| Measurement | Description | Measurement Unit | Interpretation |
|---|---|---|---|
|
Virtual CPU utilization of console |
Indicates the percentage of the allocated CPU resources that were utilized by the control domain. |
Percent |
A very high value for this measure indicates excessive CPU utilization by that processor supported by the control domain. The CPU utilization may be high because a few processes are consuming a lot of CPU, or because there are too many processes contending for a limited resource. If adequate CPU resources are not available to the control domain, then the applications executing on the domain will experience slowdowns. To check whether resource-intensive processes are executing on the primary domain, use the detailed diagnosis capability of this measure; this will list the top 10 CPU consumers on the control domain. |
|
System usage of virtual CPU by console |
Indicates the percentage of CPU time spent for system-level processing. |
Percent |
An unusually high value indicates a problem and may be due to too many system-level tasks executing simultaneously on the primary domain. |
|
Run queue length of console |
Indicates the instantaneous length of the queue in which threads are waiting for the processor cycle. This length does not include the threads that are currently being executed. |
Number |
In case of a control domain that supports multiple processors, this measure will be available only for the Summary descriptor of the test. A value consistently greater than 2 indicates that many processes could be simultaneously contending for the processor. |
|
Blocked processes on console |
Indicates the number of processes blocked for I/O, paging, etc. |
Number |
In case of a control domain that supports multiple processors, this measure will be available only for the Summary descriptor of the test. A high value could indicate an I/O problem on the control domain (e.g., a slow disk). |
|
Swap memory of console |
This metric corresponds to the swap space currently available. |
MB |
In case of a control domain that supports multiple processors, this measure will be available only for the Summary descriptor of the test. An unusually high value for the swap usage can indicate a memory bottleneck. Check the memory utilization of individual processes to figure out the process(es) that has (have) maximum memory consumption and look to tune their memory usages and allocations accordingly. |
|
Free memory of console |
Indicates the free memory available. |
MB |
In case of a control domain that supports multiple processors, this measure will be available only for the Summary descriptor of the test. A very low value of free memory is also an indication of high memory utilization on the control domain. The detailed diagnosis of this measure lists the top 10 processes responsible for maximum memory consumption on the control domain. |
|
Scan rate of console |
Indicates the memory scan rate. |
Pages/Sec |
In case of a control domain that supports multiple processors, this measure will be available only for the Summary descriptor of the test. A high value is indicative of memory thrashing. Excessive thrashing can be detrimental to application performance. |
The detailed diagnosis capability of the Virtual CPU utilization of console will list the CPU-intensive processes executing on the control domain. Resource intensive processes can be stopped to avoid excessive CPU usage. Alternatively, administrators can allocate additional CPU resources to the control domain to ensure that processes have adequate memory for execution.
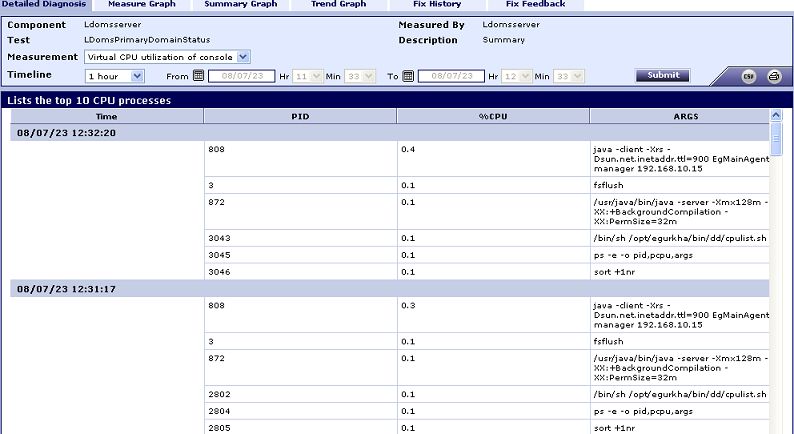
Figure 1 : The detailed diagnosis of the Physical CPU usage measure
Note:
In case of multi-processor systems, this test typically reports the CPU usage for every processor. The Summary descriptor reports the average CPU usage across processors.
The detailed diagnosis of the Free memory of console measures indicates the top-10 memory-consuming processes executing on the control domain.
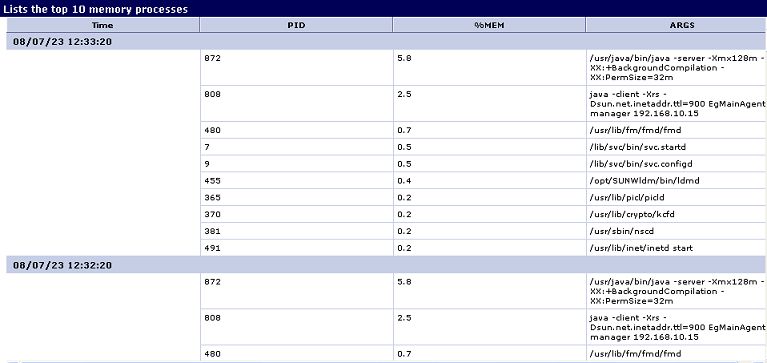
Figure 2 : The detailed diagnosis of the free memory of console measure