Monitoring the Oracle Cluster
eG Enterprise provides a dedicated Oracle Cluster model for monitoring the Oracle RAC. This is an 'agentless' model that requires the eG agent to be installed on any remote Windows host in the environment . This agent should be configured to access the cluster via the VIP or SCAN IP of any node in the cluster, so that it can report the availability of the cluster service, how load is balanced across the nodes of the service, the wait events that occur on each instance of the service, tablespace usage, lock behavior, and more!
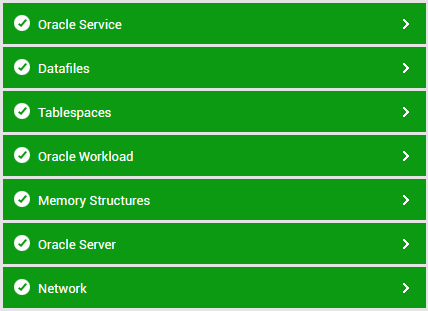
Figure 1 : The layer model of the Oracle Cluster service
Each layer of Figure 1 above is mapped to tests that report a wealth of metrics that will help cluster administrators find quick and accurate answers for the following performance queries:
- Is the cluster service available? If so, how quickly does it respond to user requests?
- Is session load uniformly balanced across all the instances of the Oracle RAC?
- Are too many wait events occurring on any instance? What type of wait events are these - checkpoint events, log file syn waits, log file parallel write events, Db file parallel write events, or Db file sequential read events?
- Is any session/session module on an instance frequently waiting for CPU, cluster resources, I/O, locks, or latches? If so, which module/session is this and which instance is it associated with?
- Has the eG agent captured on a session/session module any wait event that should typically not occur on any system?
- What is the target and estimated MTTR (Mean Time to Recovery) of each of the instances managed by the RAC?
- Is the estimate of recovery I/O and the redo blocks that must be processed by an instance during recovery too high? Will it affect MTTR?
- Are the redo log files adequately sized to avoid unnecessary checkpointing?
- Is the checkpoint auto-tuning mechanism functioning effectively?
- Is any instance unncessarily holding many transaction locks for long periods of time?
- Is any tablespace experiencing a space drain? What type of objects (tables, indexes, partitions, LOB segments, etc.) are consuming too much space in this tablespace?
- Are temporary tablespaces adequately sized?
- Is the undo tablespace of any instance taking too long to execute queries? Is it because one/more queries are inefficient? Which queries are these?
How long does an instance take to perform undo retention? Were any bottlenecks detected in this process?
The sections that follow will discuss each of the top 3 layers of Figure 1 elaborately, as the remaining layers have been dealt with in the Monitoring Oracle Database Server document.