
Monitoring the Oracle VM Manager
eG Enterprise provides a 100%, web-based Oracle VM Manager monitoring model, which periodically runs status and health checks on the Oracle VM Manager and proactively reports abnormalities.
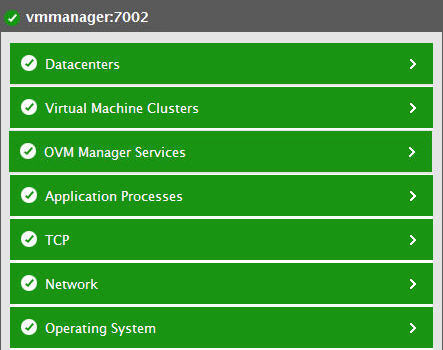
Figure 1 : The layer model of the Oracle VM Manager
Each layer of Figure 1 is mapped to tests, which employ agent-based or agentless mechanisms (depending upon how you want the Oracle VM Manager to be monitored by the eG Enterprise system) to pull out a variety of metrics from the Oracle VM Manager. To enable the tests to collect the required metrics, you need to configure each test with the following:
-
The credentials of a user with Admin rights.
The metrics so collected enable administrators to quickly find accurate answers to the following performance queries:
-
Is the web interface available? How long it took to connect to the web interface?
-
What is the current status of the Oracle VM Manager?
-
Have any error/warning events occurred on the Oracle VM Manager? What are these errors/warnings?
-
How many jobs have been successful on the Oracle VM Manager? How many jobs have actually failed and how many are outstanding?
-
How many Oracle VM servers are registered in each server pool? How many VM servers are currently running and how many are not running?
-
How many Oracle VM servers are in maintenance mode in each server pool?
-
How many VMs are available in each server pool? How many VMs in the server pool are actually running and how many are not running?
-
What is the capacity of each file system? Which filesystem is running short of disk space?
-
Is any SAN storage currently offline?
-
Is any SAN storage running out of space?
As the bottom 4 layers of Figure 1 have already been dealt with in the Monitoring Unix and Windows Servers document, let us focus on the top 3 layers alone.
