Browser Activity – OS Test
When a user complains of a virtual desktop slowdown, administrators will have to instantly figure out if that VM is experiencing a resource crunch, and if so, which process/application on the desktop is contributing to it. One of the common reasons for CPU/memory contentions and handle leaks on a virtual desktop is web browsing! If a user to a virtual desktop browses resource-intensive web sites, it is bound to result in over-usage of the resources allocated to that VM, which in turn degrades the performance of not just that VM but even the other VMs on that host. While the System Details – OS test can lead administrators to the exact browser application that is consuming the CPU/memory resources of the VM excessively, it does not provide visibility into the precise websites that were been browsed when the resource contention occurred. This is where the Browser Activity – OS test helps. For each web browser that is being accessed by a user per virtual desktop, this test reports how every browser uses the allocated CPU, memory, and disk resources and reveals the number and URLs of the web sites that are being accessed using each browser. This way, the test not only points administrators to resource-hungry browsers, but also indicates which web sites were being accessed using that browser.
Target of the test : An Oracle VirtualBox
Agent deploying the test : An internal/remote agent
Outputs of the test : One set of results for each browser used by every powered-on Windows desktop/currently logged-in user to the Windows desktop on the VirtualBox monitored.
| Parameter | Description |
|---|---|
|
Test period |
How often should the test be executed |
|
Host |
The host for which the test is to be configured. |
|
Port |
The port number at which the specified Host listens to. |
|
Oracle Hypervisor |
Specify the name of the user who has the right to access the VirtualBox via SSH. |
|
Oracle Hypervisor Password |
Provide the password of the oracle hypervisor user. |
|
Confirm Password |
Confirm the password by retyping it here. |
|
Sudocmd |
This test executes certain privileged VDA (Virtual Desktop Access) commands to pull out the desired metrics from the VirtualBox. To enable the test to run these commands, you first need to install a sudo package on the VirtualBox host. The procedure for installing this package is detailed in Pre-requisites for Auto-Discovering VMs and Obtaining their Outside View. Once the package is installed, you need to specify the full path to the install directory of the sudo package in the Sudocmd text box. |
|
Ignore VMs Inside |
Administrators of some high security virtualized environments might not have permissions to internally monitor one/more VMs. The eG agent can be configured to not obtain the 'inside view' of such ‘inaccessible’ VMs using the Ignore VMs Inside View parameter. Against this parameter, you can provide a comma-separated list of VM names, or VM name patterns, for which the inside view need not be obtained. For instance, your Ignore VMs Inside View specification can be: *xp,*lin*,win*,vista. Here, the * (asterisk) is used to denote leading and trailing spaces (as the case may be). By default, this parameter is set to none indicating that the eG agent obtains the inside view of all VMs on an Oracle VirtualBox host by default. Note: While performing VM discovery, the eG agent will not discover the operating system of the VMs configured in the Ignore VMs Inside View text box. |
|
Exclude VMs |
Administrators of some virtualized environments may not want to monitor some of their less-critical VMs - for instance, VM templates - both from 'outside' and from 'inside'. The eG agent in this case can be configured to completely exclude such VMs from its monitoring purview. To achieve this, provide a comma-separated list of VMs to be excluded from monitoring in the Exclude VMs text box. Instead of VMs, VM name patterns can also be provided here in a comma-separated list. For example, your Exclude VMs specification can be: *xp,*lin*,win*,vista. Here, the * (asterisk) is used to denote leading and trailing spaces (as the case may be). By default, this parameter is set to none indicating that the eG agent obtains the inside and outside views of all VMs on a virtual host by default. By providing a comma-separated list of VMs/VM name patterns in the Exclude VMs text box, you can make sure the eG agent stops collecting 'inside' and 'outside' view metrics for a configured set of VMs. |
|
Ignore WINNT |
By default, the eG agent does not support the inside view for VMs executing on Windows NT operating systems. Accordingly, the Ignore WINNT flag is set to Yes by default. |
|
Inside View Using |
By default, this test obtains the “inside view” of VMs using the eG VM Agent. Accordingly, the Inside view using flag is set to eG VM Agent by default. The eG VM Agent is a piece of software, which should be installed on every VM on a hypervisor. Every time the eG agent runs this test, it uses the eG VM Agent to pull relevant 'inside view' metrics from each VM. Once the metrics are collected, the eG agent then communicates with each VM agent and pulls these metrics, without requiring administrator privileges. Refer to Configuring the Remote Agent to Obtain the Inside View of VMs for more details on the eG VM Agent. |
|
Domain, Admin User, and Admin Password, and Confirm Password |
By default, these parameters are set to none. This is because, by default, the eG agent collects 'inside view' metrics using the eG VM agent on each VM. Domain administrator privileges need not be granted to the eG agent if it uses this default approach to obtain the 'inside view' of Windows VMs. |
|
Report By User |
While monitoring a VirtualBox, the Report By User flag is set to Yes by default, indicating that by default, the guest operating systems on the VirtualBox are identified using the login of the user who is accessing the guest OS. In other words, this test will, by default, report measures for every username_on_virtualmachinename. If this flag is set to No, then the guests will be identified using the host name of the guest OS. In this case, the test will report measures for every virtualmachinename. |
|
Report Powered OS |
This flag becomes relevant only if the Report By User flag is set to ‘Yes’. If the Report Powered OS flag is set to Yes (which is the default setting), then this test will report measures for even those VMs that do not have any users logged in currently. Such guests will be identified by their virtualmachine name and not by the username_on_virtualmachinename. On the other hand, if the Report Powered OS flag is set to No, then this test will not report measures for those VMs to which no users are logged in currently. |
|
DD Frequency |
Refers to the frequency with which detailed diagnosis measures are to be generated for this test. The default is 1:1. This indicates that, by default, detailed measures will be generated every time this test runs, and also every time the test detects a problem. You can modify this frequency, if you so desire. Also, if you intend to disable the detailed diagnosis capability for this test, you can do so by specifying none against DD Frequency. |
|
Detailed Diagnosis |
To make diagnosis more efficient and accurate, the eG Enterprise embeds an optional detailed diagnostic capability. With this capability, the eG agents can be configured to run detailed, more elaborate tests as and when specific problems are detected. To enable the detailed diagnosis capability of this test for a particular server, choose the On option. To disable the capability, click on the Off option. The option to selectively enable/disable the detailed diagnosis capability will be available only if the following conditions are fulfilled:
|
| Measurement | Description | Measurement Unit | Interpretation |
|---|---|---|---|
|
Recent web sites |
Indicates the number of websites that were accessed using this browser on this virtual desktop during the last measurement period. |
Number |
Use the detailed diagnosis of this measure to know which web sites are being accessed using a browser. |
|
CPU utilization |
Indicates the percentage CPU usage of this browser on this virtual desktop. |
Percent |
Compare the value of this measure across browsers to know which browser consumed the maximum CPU on a desktop. If the value of this measure is close to 100% on that desktop, it indicates excessive CPU usage by the browser. You may then want to use the detailed diagnosis of the Recent web sites measure to know which web sites are being accessed using that browser, which caused CPU usage to soar. |
|
Memory used |
Indicates the percent usage of memory by this browser on this virtual desktop. |
Percent |
Compare the value of this measure across browsers to know which browser consumed the maximum memory on a desktop. If the value of this measure is close to 100% on that desktop, it indicates excessive memory usage by the browser. You may then want to use the detailed diagnosis of the Recent web sites measure to know which web sites are being accessed using that browser, which caused CPU usage to soar. |
|
Handles used |
Indicates the number of handles opened by this browser on this virtual desktop. |
Number |
Compare the value of this measure across browsers to know which browser opened the maximum number of handles on a desktop. If the value of this measure consistently increases on that desktop, it indicates that the corresponding browser is leaking memory. You may then want to use the detailed diagnosis of the Recent web sites measure to know which web sites are being accessed using that browser, which caused the memory leak. |
|
Disk reads |
Indicates the rate at which this browser read from the disks supported by this virtual desktop. |
KB/Sec |
A high value for these measures indicates that the browser is generating high disk I/O. You may then want to use the detailed diagnosis of the Recent web sites measure of this browser to know which web sites on the browser are responsible for the high disk I/O. |
|
Disk writes |
Indicates the rate at which this browser read from the disks of this virtual desktop. |
KB/Sec |
|
|
Disk IOPS |
Indicates the rate of read and write operations performed by this browser on the disks of this virtual desktop. |
Operations/Sec |
A high value for this measure indicates that the browser is generating high disk I/O. You may then want to use the detailed diagnosis of the Recent web sites measure of this browser to know which web sites on the browser are responsible for the high disk I/O. |
|
Page faults |
Indicates the rate at which page faults by the threads executing in this browser are occurring on this virtual desktop. |
Faults/Sec |
Ideally, the value of this measure should be low. A high value for a browser is a cause for concern. You may then want to use the detailed diagnosis of the Recent web sites measure of this browser to know which web sites on the browser are responsible for page faults. |
The detailed diagnosis of the Running browser instances measure reveals the process ID of each browser instance that is currently running on the virtual desktop and the resource usage of each instance. This way, you can easily and accurately identify the instance that is consuming resources excessively.
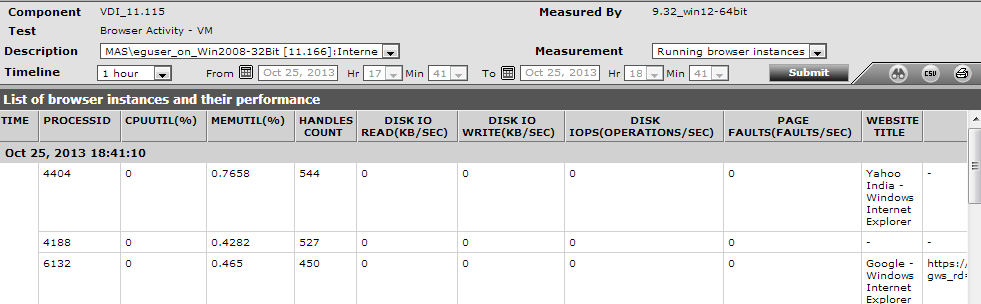
Figure 1 : The detailed diagnosis of the Running browser instances measure
The detailed diagnosis of the Recent web sites measure reveals the names and URLs of the web sites that are being accessed using a browser.
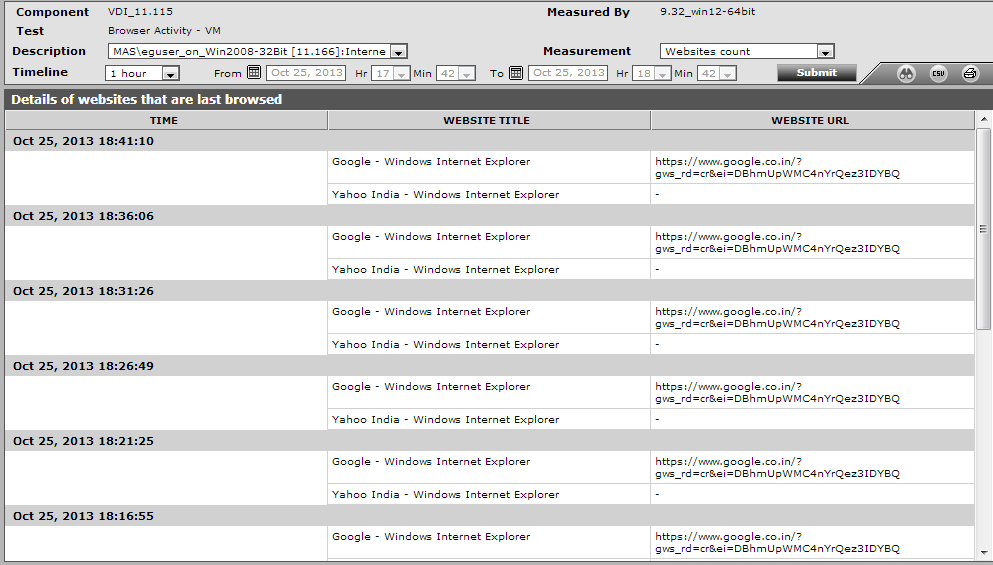
Figure 2 : The detailed diagnosis of the Recent web sites measure
As stated earlier, by default, clicking on the Virtual Desktop layer, leads you to a page displaying the current status of the individual desktops that have been configured on the Oracle VirtualBox. If you want to override this default setting - i.e., if you prefer to view the tests mapped to the Virtual Desktop layer first, and then proceed to focus on individual desktop performance, follow the steps given below:
-
Edit the eg_ui.ini file in the <EG_INSTALL_DIR>\manager\config directory
-
Set the LAYERMODEL_LINK_TO_VIRTUAL flag in the file to false; this is set to true by default.
-
Save the eg_ui.ini file.
Doing so ensures that as soon as the Virtual Desktop layer is clicked, the list of tests mapped to that layer appears. If you now want the Desktop view of Figure 1, simply click on Back button in the layer model page.
From the desktop view, you can further drill-down to focus on the health of a particular desktop, by clicking on the icon representing the desktop in Figure 1. Figure 3 then appears displaying all the performance metrics extracted from that virtual desktop in real-time. You are thus enabled to cross-correlate across the various metrics, and quickly detect the root-cause of current/probable disturbances to the internal health of a desktop. To view the time-of-day variations in a measure, you can view its graph by clicking on that measure in Figure 3.
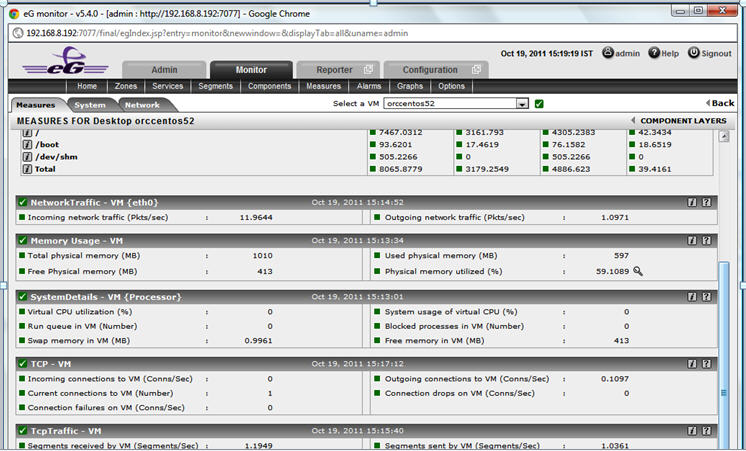
Figure 3 : The measures pertaining to a particular desktop
You can also view live graphs of pre-configured measures pertaining to the Oracle VirtualBox and the virtual desktops configured on it, by clicking on the live graphs link in Figure 1. Alternatively, you can click on the  icon that appears in the Tests panel of the layer model page when the Virtual Desktop layer is clicked to view the live graph.