
System Details - OS Test
This test collects various metrics pertaining to the CPU and memory usage of every processor supported by a desktop. The details of this test are as follows:
Target of the test : An Oracle VirtualBox
Agent deploying the test : An internal/remote agent
Outputs of the test : One set of results for every combination of virtual_guest:processor or guest_user:processor.
| Parameter | Description |
|---|---|
|
Test period |
How often should the test be executed |
|
Host |
The host for which the test is to be configured. |
|
Port |
The port number at which the specified Host listens to. |
|
Oracle Hypervisor |
Specify the name of the user who has the right to access the VirtualBox via SSH. |
|
Oracle Hypervisor Password |
Provide the password of the oracle hypervisor user. |
|
Confirm Password |
Confirm the password by retyping it here. |
|
Sudocmd |
This test executes certain privileged VDA (Virtual Desktop Access) commands to pull out the desired metrics from the VirtualBox. To enable the test to run these commands, you first need to install a sudo package on the VirtualBox host. The procedure for installing this package is detailed in Pre-requisites for Auto-Discovering VMs and Obtaining their Outside View. Once the package is installed, you need to specify the full path to the install directory of the sudo package in the Sudocmd text box. |
|
Ignore VMs Inside |
Administrators of some high security virtualized environments might not have permissions to internally monitor one/more VMs. The eG agent can be configured to not obtain the 'inside view' of such ‘inaccessible’ VMs using the Ignore VMs Inside View parameter. Against this parameter, you can provide a comma-separated list of VM names, or VM name patterns, for which the inside view need not be obtained. For instance, your Ignore VMs Inside View specification can be: *xp,*lin*,win*,vista. Here, the * (asterisk) is used to denote leading and trailing spaces (as the case may be). By default, this parameter is set to none indicating that the eG agent obtains the inside view of all VMs on an Oracle VirtualBox host by default. Note: While performing VM discovery, the eG agent will not discover the operating system of the VMs configured in the Ignore VMs Inside View text box. |
|
Exclude VMs |
Administrators of some virtualized environments may not want to monitor some of their less-critical VMs - for instance, VM templates - both from 'outside' and from 'inside'. The eG agent in this case can be configured to completely exclude such VMs from its monitoring purview. To achieve this, provide a comma-separated list of VMs to be excluded from monitoring in the Exclude VMs text box. Instead of VMs, VM name patterns can also be provided here in a comma-separated list. For example, your Exclude VMs specification can be: *xp,*lin*,win*,vista. Here, the * (asterisk) is used to denote leading and trailing spaces (as the case may be). By default, this parameter is set to none indicating that the eG agent obtains the inside and outside views of all VMs on a virtual host by default. By providing a comma-separated list of VMs/VM name patterns in the Exclude VMs text box, you can make sure the eG agent stops collecting 'inside' and 'outside' view metrics for a configured set of VMs. |
|
Ignore WINNT |
By default, the eG agent does not support the inside view for VMs executing on Windows NT operating systems. Accordingly, the Ignore WINNT flag is set to Yes by default. |
|
Inside View Using |
By default, this test obtains the “inside view” of VMs using the eG VM Agent. Accordingly, the Inside view using flag is set to eG VM Agent by default. The eG VM Agent is a piece of software, which should be installed on every VM on a hypervisor. Every time the eG agent runs this test, it uses the eG VM Agent to pull relevant 'inside view' metrics from each VM. Once the metrics are collected, the eG agent then communicates with each VM agent and pulls these metrics, without requiring administrator privileges. Refer to Configuring the Remote Agent to Obtain the Inside View of VMs for more details on the eG VM Agent. |
|
Domain, Admin User, and Admin Password, and Confirm Password |
By default, these parameters are set to none. This is because, by default, the eG agent collects 'inside view' metrics using the eG VM agent on each VM. Domain administrator privileges need not be granted to the eG agent if it uses this default approach to obtain the 'inside view' of Windows VMs. |
|
Report By User |
While monitoring a VirtualBox, the Report By User flag is set to Yes by default, indicating that by default, the guest operating systems on the VirtualBox are identified using the login of the user who is accessing the guest OS. In other words, this test will, by default, report measures for every username_on_virtualmachinename. If this flag is set to No, then the guests will be identified using the host name of the guest OS. In this case, the test will report measures for every virtualmachinename. |
|
Report Powered OS |
This flag becomes relevant only if the Report By User flag is set to ‘Yes’. If the Report Powered OS flag is set to Yes (which is the default setting), then this test will report measures for even those VMs that do not have any users logged in currently. Such guests will be identified by their virtualmachine name and not by the username_on_virtualmachinename. On the other hand, if the Report Powered OS flag is set to No, then this test will not report measures for those VMs to which no users are logged in currently. |
|
Use Top for DD |
This parameter is applicable only to Linux VMs. By default, this parameter is set to No. This indicates that, by default, this test will report the detailed diagnosis of the Virtual CPU utilization measure for each processor on a Linux VM by executing the usr/bin/ps command. On some Linux flavors however, this command may not function properly. In such cases, set the Use Top for DD parameter to Yes. This will enable the eG agent to extract the detailed diagnosis of the Virtual CPU utilization measure by executing the /usr/bin/top command instead. |
|
Detailed Diagnosis |
To make diagnosis more efficient and accurate, the eG Enterprise embeds an optional detailed diagnostic capability. With this capability, the eG agents can be configured to run detailed, more elaborate tests as and when specific problems are detected. To enable the detailed diagnosis capability of this test for a particular server, choose the On option. To disable the capability, click on the Off option. The option to selectively enable/disable the detailed diagnosis capability will be available only if the following conditions are fulfilled:
|
| Measurement | Description | Measurement Unit | Interpretation |
|---|---|---|---|
|
Virtual CPU utilization |
This measurement indicates the percentage of CPU utilized by the processor. |
Percent |
A high value could signify a CPU bottleneck. The CPU utilization may be high because a few processes are consuming a lot of CPU, or because there are too many processes contending for a limited resource. The detailed diagnosis of this test reveals the top-10 CPU-intensive processes on the guest. |
|
System usage of virtual CPU |
Indicates the percentage of CPU time spent for system-level processing. |
Percent |
An unusually high value indicates a problem and may be due to too many system-level tasks executing simultaneously. |
|
Run queue in VM |
Indicates the instantaneous length of the queue in which threads are waiting for the processor cycle. This length does not include the threads that are currently being executed. |
Number |
A value consistently greater than 2 indicates that many processes could be simultaneously contending for the processor. |
|
Blocked processes in VM |
Indicates the number of processes blocked for I/O, paging, etc. |
Number |
A high value could indicate an I/O problem on the guest (e.g., a slow disk). |
|
Swap memory in VM |
Denotes the committed amount of virtual memory. This corresponds to the space reserved for virtual memory on disk paging file(s). |
MB |
An unusually high value for the swap usage can indicate a memory bottleneck. Check the memory utilization of individual processes to figure out the process(es) that has (have) maximum memory consumption and look to tune their memory usages and allocations accordingly. |
|
Free memory in VM |
Indicates the free memory available. |
MB |
A very low value of free memory is also an indication of high memory utilization on a guest. |
|
Scan rate in VM |
Indicates the memory scan rate. |
Pages/Sec |
A high value is indicative of memory thrashing. Excessive thrashing can be detrimental to guest performance. |
Note:
For multi-processor systems, where the CPU statistics are reported for each processor on the system, the statistics that are system-specific (e.g., run queue length, free memory, etc.) are only reported for the "Summary" descriptor of this test.
The detailed diagnosis capability of the Virtual CPU utilization measure, if enabled, provides a listing of the top 10 CPU-consuming processes (see Figure 6). In the event of a CPU bottleneck, this information will enable users to identify the processes consuming a high percentage of CPU time. The users may then decide to stop such processes, so as to release the CPU resource for more important processing purposes.
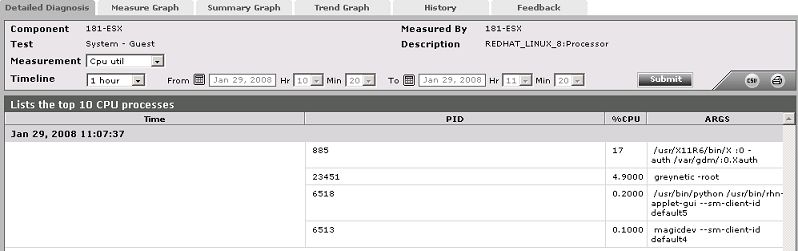
Figure 6 : The top 10 CPU consuming processes
Note:
While instantaneous spikes in CPU utilization are captured by the eG agents and displayed in the Measures page, the detailed diagnosis will not capture/display such instantaneous spikes. Instead, detailed diagnosis will display only a consistent increase in CPU utilization observed over a period of time.
