Monitoring Oracle Web Servers
eG Enterprise provides a specialized monitoring model for the Oracle Web server (see Figure 1), which runs periodic health checks on the server, determines its current state, detects performance issues (if any), and proactively alerts administrators to these issues, so that they can hasten the remedial measures.
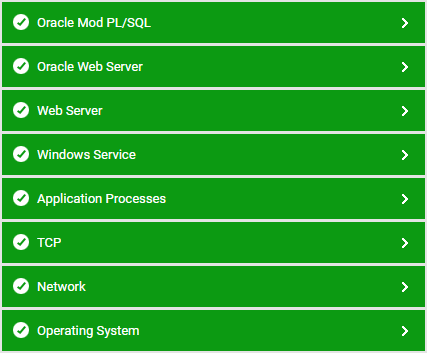
Figure 1 : The layer model of an Oracle Web server
This model constitutes a set of hierarchical layers, which are mapped to a wide variety of tests. When the eG agent on the Oracle HTTP server executes these tests, it pulls out a wealth of performance information from the server. In the light of the statistics so retrieved, administrators can find answers to the following performance queries:
- Is the web server responding quickly to user requests?
- What is the current load on the server in terms of data traffic?
- Do errors occur on the web server? If so, how frequently do they occur, and what are the corresponding error codes?
- Are the PL/SQL Gateway’s session and content caches utilized effectively, or are there too many cache misses?
- How well does the PL/SQL gateway respond to user requests? Are there too many errored responses?
Note:
Any component on an Oracle 9i Application server (be it OC4J or the Oracle Web server) can be monitored by eG only if the Oracle 9i Application Server Release 2.0 is installed, with dmctl and dmstool.
The sections to come deal only with the top 2 layers of Figure 1, as all other layers have been dealt with extensively in the Monitoring IIS Web servers document .