WebLogic Servlets Test
This test periodically tracks the servlets invoked and reloaded, and measures the minimum, maximum, and average response times of a specific server instance. Use the Click here hyperlink in the test configuration page to configure the servlet groups that need to be monitored by the eG Enterprise. By default, eG Enterprise system monitors only those servlets that are part of a group.
Target of the test : A WebLogic Application Server
Agent deploying the test : An internal agent
Outputs of the test : One set of results for every servlet group configured.
| Parameter | Description |
|---|---|
|
Test Period |
How often should the test be executed. |
|
Host |
The IP address of the host for which this test is to be configured. |
|
Port |
The port at which the specified host listens. By default, this is NULL. |
|
AdminServerHost and AdminServerPort |
In some highly secured environments, the eG agent may not be able to collect certain critical metrics related to JDBC from a managed WebLogic server. In such cases, to enable the eG agent to collect the required metrics, you should specify the IP address and Port of the WebLogic admin server to which the managed WebLogic server is associated with. This will enable the eG agent to connect to the WebLogic admin server and collect the required metrics pertaining to the managed WebLogic server. Specify the IP address and Port of the WebLogic admin server in the AdminServerHost and AdminServerPort text boxes. By default, these parameters are set to none. |
|
JSPTimeOut |
Specify the duration (in seconds) within which the eG agent should receive the response from the eGurkha WAR file deployed on the WebLogic server in this text box. By default, this is set to is 120 seconds. |
|
User |
The admin user name of the WebLogic server being monitored. |
|
Password |
The password of the specified admin user. |
|
Confirm Password |
Confirm the password by retyping it here. |
|
EncryptPass |
If the specified password needs to be encrypted, set the EncryptPass flag to Yes. Otherwise, set it to No. By default, the Yes option will be selected. Note: If the UseWarFile flag is set to No, then make sure that the EncryptPass flag is also set to No. |
|
SSL |
Indicate whether the SSL (Secured Socket Layer) is to be used to connect to the WebLogic server. |
|
Server |
The name of the specific server instance to be monitored for a WebLogic server (the default value is "localhome") |
|
URL |
The URL to be accessed to collect metrics pertaining to the WebLogic server. By default, this test connects to a managed WebLogic server and attempts to obtain the metrics of interest by accessing the local Mbeans of the server. This parameter can be changed to a value of http://<adminserverIP>:<adminserverPort>. In this case, the test connects to the WebLogic admin server to collect metrics pertaining to the managed server (specified by the Host and Port). Though the URL setting provides the administrator with the flexibility of determining the WebLogic monitoring configuration to use, it is not recommended to monitor multiple managed WebLogic servers through the WebLogic admin server, as this may lead to performance overheads and potential request handling issues on the WebLogic admin server. Note: If the admin server is to be used for collecting measures for all the managed WebLogic servers, then it is mandatory that the egurkha war file is deployed to the admin server, and it is up and running. |
|
Version |
The Version text box indicates the version of the Weblogic server to be managed. The default value is "none", in which case the test auto-discovers the weblogic version. If the value of this parameter is not "none", the test uses the value provided (e.g., 7.0) as the weblogic version (i.e., it does not auto-discover the weblogic server version). This parameter has been added to address cases when the eG agent is not able to discover the WebLogic server version. |
|
UseWarFile |
This flag indicates whether/not monitoring is to be done using a Web archive file deployed on the WebLogic server (in which case, HTTP/HTTPS is used by the server to connect to the server). If this flag is set to No, the agent directly connects to the WebLogic server using the T3 protocol (no other file needs to be deployed on the WebLogic server for this to work). Note that the T3 protocol-based support is available for WebLogic servers ver.9 and above. Also, if the UseWarFile parameter is set to No, make sure that the EncryptPass parameter is set to No as well. When monitoring a WebLogic server deployed on a Unix platform particularly, if the UseWarFile parameter is set to No, you have to make sure that the eG agent install user is added to the WebLogic users group. |
|
WebLogicJARLocation |
Specify the location of the WebLogic server's java archive (Jar) file. If the UseWarFile flag is set to No, then the weblogic.jar file specified here is used to connect to the corresponding WebLogic server using the T3 protocol. Note that the T3 protocol-based support is available for WebLogic servers ver.9 and above. |
|
AutoDiscovery |
By default, eG Enterprise allows administrators to configure EJB groups using the eG administrative interface, and reports metrics pertaining to every group so created. Accordingly, by default, AutoDiscovery is set to No. If you want EJBs to be discovered and monitored automatically, then select the Yesoption against AutoDiscovery. When this is done, the eG agent automatically discovers all the EJBs on the WebLogic server, and reports one set of measures for every EJB so discovered. |
|
Detailed Diagnosis |
To make diagnosis more efficient and accurate, the eG Enterprise embeds an optional detailed diagnostic capability. With this capability, the eG agents can be configured to run detailed, more elaborate tests as and when specific problems are detected. To enable the detailed diagnosis capability of this test for a particular server, choose the On option. To disable the capability, click on the Off option. The option to selectively enable/disable the detailed diagnosis capability will be available only if the following conditions are fulfilled:
|
| Measurement | Description | Measurement Unit | Interpretation |
|---|---|---|---|
|
Max execution time of servlet |
The average duration for which the single longest invocation of all the servlets within a servlet group executed since creation |
Number |
|
|
Min execution time of servlet |
The average duration for which the single shortest invocation of all the servlets in a servlet group executed since creation |
Secs |
|
|
Invocation count of servlet |
The total number of times the servlets within a servlet group were invoked |
Number |
Comparing this value across servlets can provide an indication of the relative popularity of the servlets. An administrator can use information about invocations to determine the servlet(s), by tuning which the performance of the service can be significantly improved. |
|
Reloads of servlet |
The total number of times for which the servlets within a servlet group were reloaded |
Number |
|
|
Avg execution of servlet |
The average of response time of the servlets in a servlet group |
Secs |
This measure indicates which servlet(s) are providing slow response. An increased execution time can be attributed to poor design of the servlet code, slow database access or non-optimal queries. |
The detailed diagnosis of the all the above measures, if enabled, reveals the maximum execution time, minimum execution time, invocation count, reload count, and average execution time for every servlet in the configured servlet groups. Note that the detailed diagnosis information will not be available if the AutoDiscovery parameter is set to ‘Yes’.
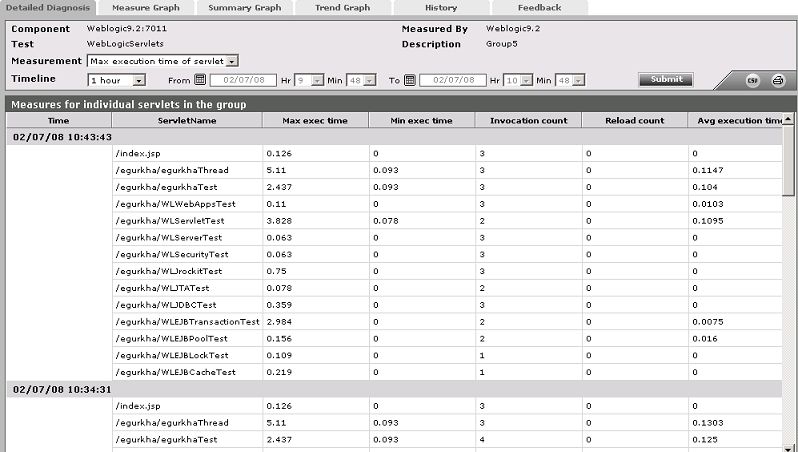
Figure 1 : The detailed diagnosis of the Max execution time measure