
Link Statistics Test
PacketShaper's access-link monitoring feature allows PacketShaper to deal with this "imperfect" load-balancing issue and has the ability to respond to the occurrence of WAN link failure. When access-link monitoring is enabled, PacketShaper can adjust partitions appropriately to prevent overloading any given WAN link and to account for lost available capacity due to router or link failure.
In order to optimize bandwidth usage, minimize traffic congestions, and maximize the speed of WAN links, administrators need to define the WAN links requiring traffic acceleration in the PacketShaper S-Series load balancer, set the bandwidth limit for each of the links for receiving/sending data, and associate each link with traffic shaping policies. But, once the configuration is complete, it is essential for the administrators to test the correctness of the configuration. For this, administrators can use the Link Statistics test. For each WAN link configured in the target load balancer, this test reports real-time metrics of the volume of traffic handled by the link and packet drops over the link. This way, the test reveals those links that are candidates for fine-tuning, owing to their low throughput despite the traffic shaping and acceleration rules that apply to them.
Target of the test : PacketShaper Load Balancer S-Series
Agent deploying the test : An external agent
Outputs of the test : One set of the results for each WAN link configured on the target PacketShaper Load Balancer S-Series device that is being monitored
| Parameter | Description |
|---|---|
|
Test period |
How often should the test be executed |
|
Host |
The IP address of the host for which this test is to be configured. |
|
SNMPPort |
The port at which the monitored target exposes its SNMP MIB; the default is 161. |
|
SNMPVersion |
By default, the eG agent supports SNMP version 1. Accordingly, the default selection in the SNMPversion list is v1. However, if a different SNMP framework is in use in your environment, say SNMP v2 or v3, then select the corresponding option from this list. |
|
SNMPCommunity |
The SNMP community name that the test uses to communicate with the firewall. This parameter is specific to SNMP v1 and v2 only. Therefore, if the SNMPVersion chosen is v3, then this parameter will not appear. |
|
Username |
This parameter appears only when v3 is selected as the SNMPversion. SNMP version 3 (SNMPv3) is an extensible SNMP Framework which supplements the SNMPv2 Framework, by additionally supporting message security, access control, and remote SNMP configuration capabilities. To extract performance statistics from the MIB using the highly secure SNMP v3 protocol, the eG agent has to be configured with the required access privileges – in other words, the eG agent should connect to the MIB using the credentials of a user with access permissions to be MIB. Therefore, specify the name of such a user against this parameter. |
|
Context |
This parameter appears only when v3 is selected as the SNMPVERSION. An SNMP context is a collection of management information accessible by an SNMP entity. An item of management information may exist in more than one context and an SNMP entity potentially has access to many contexts. A context is identified by the SNMPEngineID value of the entity hosting the management information (also called a contextEngineID) and a context name that identifies the specific context (also called a contextName). If the Username provided is associated with a context name, then the eG agent will be able to poll the MIB and collect metrics only if it is configured with the context name as well. In such cases therefore, specify the context name of the Username in the Context text box. By default, this parameter is set to none. |
|
AuthPass |
Specify the password that corresponds to the above-mentioned Username. This parameter once again appears only if the SNMPversion selected is v3. |
|
Confirm Password |
Confirm the AuthPass by retyping it here. |
|
AuthType |
This parameter too appears only if v3 is selected as the SNMPversion. From the AuthType list box, choose the authentication algorithm using which SNMP v3 converts the specified username and password into a 32-bit format to ensure security of SNMP transactions. You can choose between the following options:
|
|
EncryptFlag |
This flag appears only when v3 is selected as the SNMPversion. By default, the eG agent does not encrypt SNMP requests. Accordingly, the this flag is set to No by default. To ensure that SNMP requests sent by the eG agent are encrypted, select the Yes option. |
|
EncryptType |
If the EncryptFlag is set to Yes, then you will have to mention the encryption type by selecting an option from the EncryptType list. SNMP v3 supports the following encryption types:
|
|
EncryptPassword |
Specify the encryption password here. |
|
Confirm Password |
Confirm the encryption password by retyping it here. |
|
Timeout |
Specify the duration (in seconds) within which the SNMP query executed by this test should time out in this text box. The default is 10 seconds. |
|
EngineID |
This parameter appears only when v3 is selected as the SNMPVersion. Sometimes, the test may not report metrics when AES192 or AES256 is chosen as the Encryption type. To ensure that the test report metrics consistently, administrators need to set this flag to Yes. By default, this parameter is set to No. |
|
Data Over TCP |
By default, in an IT environment, all data transmission occurs over UDP. Some environments however, may be specifically configured to offload a fraction of the data traffic – for instance, certain types of data traffic or traffic pertaining to specific components – to other protocols like TCP, so as to prevent UDP overloads. In such environments, you can instruct the eG agent to conduct the SNMP data traffic related to the monitored target over TCP (and not UDP). For this, set this flag to Yes. By default, this flag is set to No. |
|
Detailed Diagnosis |
To make diagnosis more efficient and accurate, the eG Enterprise embeds an optional detailed diagnostic capability. With this capability, the eG agents can be configured to run detailed, more elaborate tests as and when specific problems are detected. To enable the detailed diagnosis capability of this test for a particular server, choose the On option. To disable the capability, click on the Off option. The option to selectively enable/disable the detailed diagnosis capability will be available only if the following conditions are fulfilled:
|
|
Measurement |
Description |
Measurement Unit |
Interpretation |
|---|---|---|---|
|
Transmitted data |
Indicates the amount of data transmitted over this WAN link during the last measurement period. |
MB |
Any attempt made to send or receive traffic faster than the link throughput can result in congestion. Therefore, the load balancer should make sure that just about enough data is sent and received over application links to prevent congestion and optimize throughput. If the values of these measures exceed or are dangerously close to the bandwidth limit of the link, it signals a potential congestion or slowdown of traffic over the link. It also indicates that you may have to reconfigure the load balancer with more robust QoS and compression rules to prevent such unpleasant eventualities. The detailed diagnosis of the Transmitted data measure lists the Shaping mode, Auto classification mode, the rate at which data is transmitted over the WAN link and the link size.
|
|
Received data |
Indicates the amount of data received over this WAN link during the last measurement period. |
MB |
Any attempt made to send or receive traffic faster than the link throughput can result in congestion. Therefore, the load balancer should make sure that just about enough data is sent and received over application links to prevent congestion and optimize throughput. If the values of these measures exceed or are dangerously close to the bandwidth limit of the link, it signals a potential congestion or slowdown of traffic over the link. It also indicates that you may have to reconfigure the load balancer with more robust QoS and compression rules to prevent such unpleasant eventualities. |
|
Transmitted packets |
Indicates the number of packets transmitted over this WAN link during the last measurement period. |
Number |
Any attempt made to send or receive traffic faster than the link throughput can result in congestion. Therefore, the load balancer should make sure that just about enough data packets are sent and received over application links to prevent congestion and maximize throughput. If the values of these measures exceed or are dangerously close to the maximum number of data packets that the link can handle, it signals a potential congestion or slowdown of traffic over the link. It also indicates that you may have to reconfigure the load balancer with more robust QoS and compression rules to prevent such unpleasant eventualities.
|
|
Received packets |
Indicates the number of packets received over this WAN link during the last measurement period. |
Number |
|
|
Packets transmission over Passthru |
Indicates the number of packets transmitted through Passthru mode over this WAN link during the last measurement period. |
Number |
This measure will be reported only when traffic shaping capability is enabled on the target PacketShaper S-Series load balancer. When shaping is turned on, traffic is classified and measured, and control policies are enforced. When shaping is off, traffic is classified and measured but not managed. |
|
Data transmission over Passthru |
Indicates the amount of data transmitted through Passthru mode over this WAN link during the last measurement period. |
MB |
This measure will be reported only when traffic shaping capability is enabled on the target PacketShaper S-Series load balancer. |
|
Dropped transmitted packets |
Indicates the number of packets not sent over this WAN link during the last measurement period. |
Number |
Ideally, the value of this measure should be zero. Packets may be frequently dropped due to errors encountered by the hardware of the device. Compare the value across the WAN links to determine the WAN link on which frequent packet drops are noticed during transmission. |
|
Dropped received packets |
Indicates the number of packets not received over this WAN link during the last measurement period. |
Number |
Ideally, the value of this measure should be zero. Packets may be frequently dropped due to errors encountered by the hardware of the device. Compare the value across the WAN links to determine the WAN link on which frequent packet drops are noticed during transmission. |
The detailed diagnosis of the Transmitted data measure lists the Shaping mode, Auto classification mode, the rate at which data is transmitted over the WAN link and the link size.
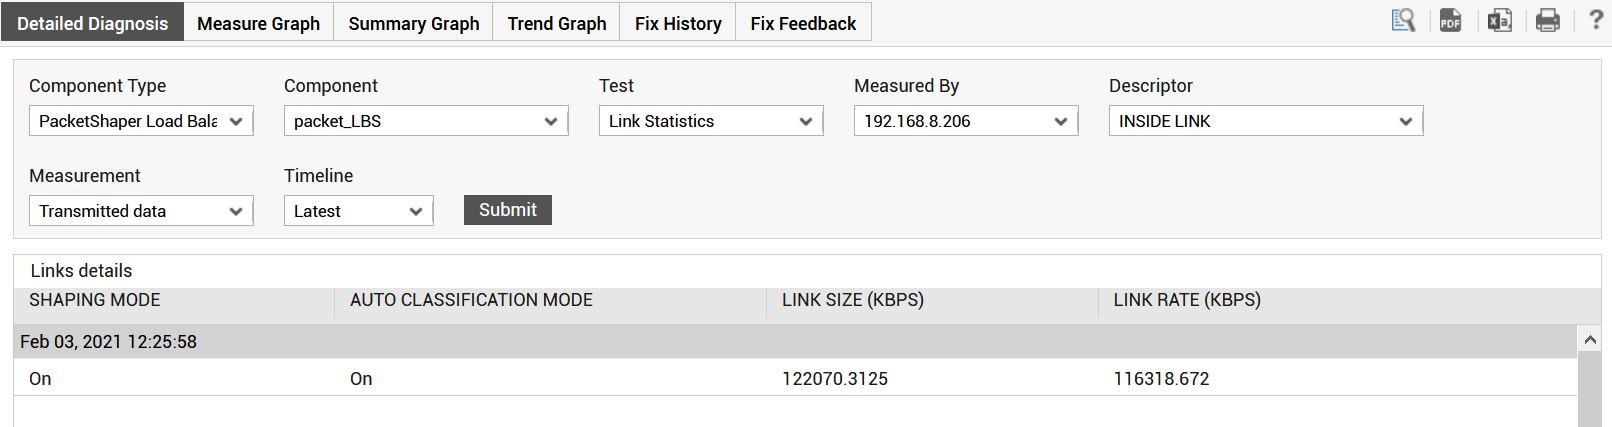
Figure 1 : The detailed diagnosis of the Transmitted data measure
