Monitoring PacketShaper Load Balancer
eG Enterprise offers an exclusive PacketShaper Load Balancer monitoring model (see Figure 1), reports deviations much before they impact the performance of the load balancer.
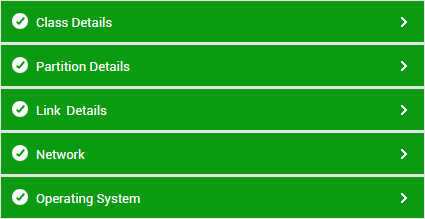
Figure 1 : The layer model of the PacketShaper Load Balancer
The metrics reported by the tests associated with the above-layers will accurately answer the following queries:
- How well the CPU is utilized by the load balancer?
- How much of memory is available for use in the laod balancer in terms of percentage?
- What is the current operational status of the loadd balancer?
- What is the current status of each fan and power supply unit?
- How many SYN flood attacks are blocked on a client/server when SYN packets were sent/received over each traffic class?
- How many HTTP errors are encountered when data is transmitted from each traffic class on the client /server?
- How many CIR failure events are registered for each traffic class?
- How well data/packets are transmitted through each traffic class and how many packets were transmitted over TCP?
- How many packets are retransmitted over TCP for each traffic class?
- How many TCP connections are initiated on each traffic class?
- How many TCP connections are terminated and how many TCP connections were refused for each traffic class?
- How many TCP connections are ignored/aborted/denied for each traffic class?
- What is the current rate at which data is transmitted through each traffic class?
- What is the amount of low order data and high order data that is passed through each traffic class?
- How much of low order data and high order data are dropped during transmission through each traffic class?
- What is the amount of high order data/low order data received in non compressed state through each traffic class?
- How much of low order data/high order data is received before compression and after compression through each traffic class?
- What is the count of frames in each partition?
- How many CIR failure events are registered on each partition?
- How many packets passed through each partition?
- How many packets are transmitted over TCP for each partition?
- How many packet drops are noticed on each partition and which partition contribured to maximum number of packet drops?
- How many TCP connections are initiated on each partition?
- How many TCP connections are refused/ignored/aborted/denied for each partition?
- How much of data is dropped during transmission on each partition?
- What is the amount of high order data/low order data received in non compressed state through each partition?
- How much of low order data/high order data is received before compression and after compression through each partition?
- How many packets passed through each WAN link?
- How many packets are transmitted/retransmitted over TCP through each WAN link?
- How many packets were dropped due to hardware errors during transmission/reception through each WAN link?
- How many TCP connections are initiated on each WAN link?
- How many TCP connections are refused/ignored/aborted/denied for each WAN link?
- How much of data is dropped during transmission on each WAN link?
- What is the amount of high order data/low order data received in non compressed state through each WAN link?
- How much of low order data/high order data is received before compression and after compression through each WAN link?
Since the tests mapped to the Network Layer are elaborately discussed in Monitoring Cisco Router document, the sections to come will discuss the other layers in detail.