Monitoring the Progress database servers
Any performance degradation or unavailability of the database servers can severely impact the performance of the entire service, often causing customer dissatisfaction and lost business revenue. Continuous monitoring of the Progress database servers are hence imperative.
The pre-built Progress database server monitoring model that eG Enterprise offers (see Figure 1), provides in-depth monitoring for the Progress database servers.
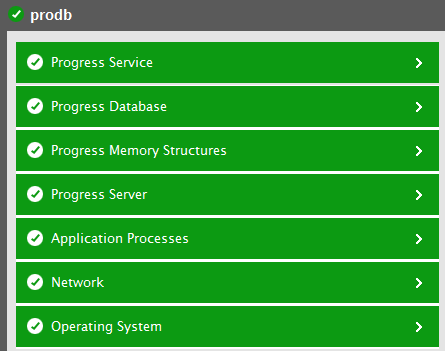
Figure 1 : The layer model of the Progress database server
Each of the layers of this hierarchical model reports a wide variety of metrics ranging from the basic operating system-level statistics to individual database related measurements to those indicating the database engine health. Using these measurements , administrators can easily answer the following questions:
- How many writes were performed on the after-image file per second?
- How many writes were performed by the after-image writer to the after-image file per second?
- How many writes were performed on the before-image file per second?
- How many wirtes were performed by the before-image writer to the before-image file per second?
- How many time Buffer Busy Waits actually occurred on the before-image file?
- At what rate were the read/write operations performed on the database block of each buffer pool?
- What was the percentage of database blocks served from each buffer pool?
- What is the total number of buffers in the buffer cache of the database?
- How well the buffers in the buffer cache have been utilized?
- How many buffers are there in the page writer queue and the checkpoint queue?
- At what rate were the read/write operations performed on each datafile?
- At what rate were the data related to each datafile were read/written to the buffer?
- How long has the Progress database been up and running?
- Has the database instance been rebooted recently?
- What was the rate at which indexes were created, deleted, scanned etc?
- What is the ration of index splits to index generation?
- What is the rate at which the latches of each type were busy?
- What is the rate at which locks were held on latches of each type?
- How long was the latch of each type held?
- What is the average duration for which sessions were waiting for the latch of each type?
- What is the rate at which different locks (for e.g., EXCLUSIVE, TRANSACTION, SHARED, RECORD) were held by each user?
- How many locks were held by each user accessing the Progress database server?
- What is the rate at which the locks were being held by each user?
- How many sessions were established by each user on the Progress database server?
- At what rate were the sessions established for each user?
- What is the availability and responsiveness of the database server?
- How well each storage area is being utilized?
- What is the total amount of space allocated to each storage area?
- What is the throughput of the database server? How well data/packets were transmitted/received through the Progress database server?
- How well the read/write operations were performed on the database server by each user?
- How many reads/writes were performed by each user to the before-image file/after-image file of the database?
The Operating System, Network and Application Processes layers of the Progress database server monitoring model is similar to that of a Windows server model. Since these tests have been dealt with in the Monitoring Unix and Windows Servers document, let us now focus on the remaining layers of the Progress database server.