Disk Activity - OS Test
This test reports statistics pertaining to the input/output utilization of each physical disk on a virtual machine.
Target of the test : A Proxmox Hypervisor
Agent deploying the test : An internal/remote agent
Outputs of the test : One set of results for every combination of virtual_machine:disk_partition
| Parameter | Description |
|---|---|
|
Test period |
How often should the test be executed. |
|
Host |
The IP address of the host for which this test is to be configured. |
|
Port |
The port at which the specified host listens. By default, this will be NULL. |
|
Proxmox Node Name |
Specify the name of the Proxmox node that you wish to monitor in this text box. By default, this parameter is set to none indicating that the test monitor all the nodes in the target hypervisor. |
|
Ignore VMs Inside View |
Administrators of some high security Proxmox environments might not have permissions to internally monitor one/more VMs. The eG agent can be configured to not obtain the 'inside view' of such ‘inaccessible’ VMs using the Ignore VMs Inside View parameter. Against this parameter, you can provide a comma-separated list of VM names, or VM name patterns, for which the inside view need not be obtained. For instance, yourIgnore VMs Inside View specification can be: *xp,*lin*,win*,vista. Here, the * (asterisk) is used to denote leading and trailing spaces (as the case may be). By default, this parameter is set to none indicating that the eG agent obtains the inside view of all VMs on a Proxmox Hypervisor by default. Note: While performing VM discovery, the eG agent will not discover the operating system of the VMs configured in the Ignore VMs Inside View text box. |
|
Ignore WINNT |
By default, the eG agent does not support the inside view for VMs executing on Windows NT operating systems. Accordingly, the Ignore WINNT flag is set to Yes by default. |
|
Exclude VMs |
Administrators of some virtualized environments may not want to monitor some of their less-critical VMs - for instance, VM templates - both from 'outside' and from 'inside'. The eG agent in this case can be configured to completely exclude such VMs from its monitoring purview. To achieve this, provide a comma-separated list of VMs to be excluded from monitoring in the Exclude VMs text box. Instead of VMs, VM name patterns can also be provided here in a comma-separated list. For example, your Exclude VMs specification can be: *xp,*lin*,win*,vista. Here, the * (asterisk) is used to denote leading and trailing spaces (as the case may be). By default, this parameter is set to none indicating that the eG agent obtains the inside and outside views of all VMs on a virtual host by default. By providing a comma-separated list of VMs/VM name patterns in the Exclude VMs text box, you can make sure the eG agent stops collecting 'inside' and 'outside' view metrics for a configured set of VMs. |
|
Domain, Admin User, Admin Password, and Confirm Password |
By default, this test connects to each virtual guest remotely and attempts to collect “inside view” metrics. In order to obtain a remote connection, the test must be configured with user privileges that allow remote communication with the virtual guests. The first step towards this is to specify the Domain within which the virtual guests reside. The Admin User and Admin Password will change according to the Domain specification. Discussed below are the different values that the Domain parameter can take, and how they impact the Admin User and Admin Password specifications:
|
|
Report By User |
While monitoring a Proxmox Hypervisor, the Report By User flag is set to No by default, indicating that by default, the VM operating systems on the target hypervisor are identified using the hostname specified in the operating system. On the other hand, if you want the desktops to be identified using the login of the user who is accessing them, set this flag to Yes. In other words, in VDI environments, this test will, by default, report measures for every username_on_virtualmachinename. |
|
Report Powered OS |
This flag becomes relevant only if the Report By User flag is set to ‘Yes’. If this flag is set to Yes (which is the default setting), then this test will report measures for even those VMs that do not have any users logged in currently. Such guests will be identified by their virtualmachine name and not by the username_on_virtualmachinename. On the other hand, if the Report Powered OS flag is set to No, then this test will not report measures for those VMs to which no users are logged in currently. |
|
Disk Busy in Percent |
Specify the percentage of time beyond which the test should reveal the detailed diagnosis for the Disk Busy measure. By default, this parameter is set to 25. However, you can override this value as per your requirement. |
|
Use IOTOP |
This test uses the iotop command to collect detailed diagnostics on disk activity from Linux VMs. By default, this flag is set to No, indicating that the test will not use the iotop command – this in turn implies that this test will not report detailed diagnostics for Linux VMs by default. If you want the test to report detailed metrics on disk activity on Linux VMs, set this flag to Yes. |
|
Use Sudo |
This parameter is of significance to Linux VMs only. By default, the Use SUDO parameter is set to No. This indicates that, by default, this test will report the detailed diagnosis for the Percent virtual disk busy measure of each disk partition being monitored by executing the /usr/bin/iotop command or /usr/sbin/iotop command. However, in some highly secure virtualized environments, this command cannot be executed directly on a Linux. In such cases, set this parameter to Yes. This will enable the eG agent to execute the sudo/usr/bin/iotop command or sudo/usr/sbin/iotop and retrieve the detailed diagnosis of the Percent virtual disk busy measure. |
|
DD Frequency |
Refers to the frequency with which detailed diagnosis measures are to be generated for this test. The default is 1:1. This indicates that, by default, detailed measures will be generated every time this test runs, and also every time the test detects a problem. You can modify this frequency, if you so desire. Also, if you intend to disable the detailed diagnosis capability for this test, you can do so by specifying none against DD frequency. |
|
Detailed Diagnosis |
To make diagnosis more efficient and accurate, the eG Enterprise embeds an optional detailed diagnostic capability. With this capability, the eG agents can be configured to run detailed, more elaborate tests as and when specific problems are detected. To enable the detailed diagnosis capability of this test for a particular server, choose the On option. To disable the capability, click on the Off option. The option to selectively enable/disable the detailed diagnosis capability will be available only if the following conditions are fulfilled:
|
| Measurement | Description | Measurement Unit | Interpretation |
|---|---|---|---|
|
Percent virtual disk busy |
Indicates the percentage of elapsed time during which the disk is busy processing requests (i.e., reads or writes). |
Percent |
Comparing the percentage of time that the different disks are busy, an administrator can determine whether load is properly balanced across the different disks. The detailed diagnosis of this measure, if enabled, provides information such as the Process IDs executing on the disk, the Process names, the rate at which I/O read and write requests were issued by each of the processes , and the rate at which data was read from and written into the disk by each of the processes. In the event of excessive disk activity, the details provided in the detailed diagnosis page will enable users to figure out which process is performing the I/O operation that is keeping the disk busy. The detailed diagnosis for this test is available for Windows guests only, and not Linux guests. |
|
Percent reads from virtual disk |
Indicates the percentage of elapsed time that the selected disk drive is busy servicing read requests. |
Percent |
|
|
Percent writes to virtual disk |
Indicates the percentage of elapsed time that the selected disk drive is busy servicing write requests. |
Percent |
|
|
Virtual disk read time |
Indicates the average time in seconds of a read of data from the disk. |
Secs |
|
|
Virtual disk write time |
Indicates the average time in seconds of a write of data from the disk. |
Secs |
|
|
Avg. queue for virtual disk |
Indicates the average number of both read and write requests that were queued for the selected disk during the sample interval. |
Number |
|
|
Current queue for virtual disk |
The number of requests outstanding on the disk at the time the performance data is collected. |
Number |
This measure includes requests in service at the time of the snapshot. This is an instantaneous length, not an average over the time interval. Multi-spindle disk devices can have multiple requests active at one time, but other concurrent requests are awaiting service. This counter might reflect a transitory high or low queue length, but if there is a sustained load on the disk drive, it is likely that this will be consistently high. Requests experience delays proportional to the length of this queue minus the number of spindles on the disks. This difference should average less than two for good performance. |
|
Reads from virtual disk |
Indicates the number of reads happening on a logical disk per second. |
Reads/Sec |
A dramatic increase in this value may be indicative of an I/O bottleneck on the guest. |
|
Data reads from virtual disk |
Indicates the rate at which bytes are transferred from the disk during read operations. |
KB/Sec |
A very high value indicates an I/O bottleneck on the guest. |
|
Writes to virtual disk |
Indicates the number of writes happening on a local disk per second. |
Writes/Sec |
A dramatic increase in this value may be indicative of an I/O bottleneck on the guest. |
|
Data writes to virtual disk |
Indicates the rate at which bytes are transferred from the disk during write operations. |
KB/Sec |
A very high value indicates an I/O bottleneck on the guest. |
|
Disk service time |
Indicates the average time that this disk took to service each transfer request ( i.e., the average I/O operation time) |
Secs |
A sudden rise in the value of this measure can be attributed to a large amount of information being input or output. A consistent increase however, could indicate an I/O processing bottleneck. |
|
Disk queue time |
Indicates the average time that transfer requests waited idly on queue for this disk. |
Secs |
Ideally, the value of this measure should be low. |
|
Disk IO time |
Indicates the average time taken for read and write operations of this disk. |
Secs |
The value of this measure is the sum of the values of the Disk service time and Disk queue time measures. A consistent increase in the value of this measure could indicate a latency in I/O processing. |
|
Avg IO read size |
Indicates the average number of bytes transferred from disk during read operations. |
KB |
Larger I/Os tend to have higher latency (for example, BACKUP/RESTORE operations issue 1 MB transfers by default). These measures are reported for Windows VMs only. |
|
Avg I/O write size |
Indicates the average number of bytes transferred into disk during write operations. |
KB |
|
|
Split IO |
Reports the rate at which the operating system divides I/O requests to the disk into multiple requests. |
Splits/Sec |
A split I/O request might occur if the program requests data in a size that is too large to fit into a single request or if the disk is fragmented. Factors that influence the size of an I/O request can include application design, the file system, or drivers. A high rate of split I/O might not, in itself, represent a problem. However, on single-disk systems, a high rate for this counter tends to indicate disk fragmentation. This measure is reported for Windows VMs only. |
Configuring Users for VM Monitoring
In order to enable the eG agent to connect to VMs in multiple domains and pull out metrics from them, the eG administrative interface provides a special page using which the different Domain names, and their corresponding Admin User names and Admin Passwords can be specified. To access this page, just click on the ![]() hyperlink in any of the VM test configuration pages.
hyperlink in any of the VM test configuration pages.
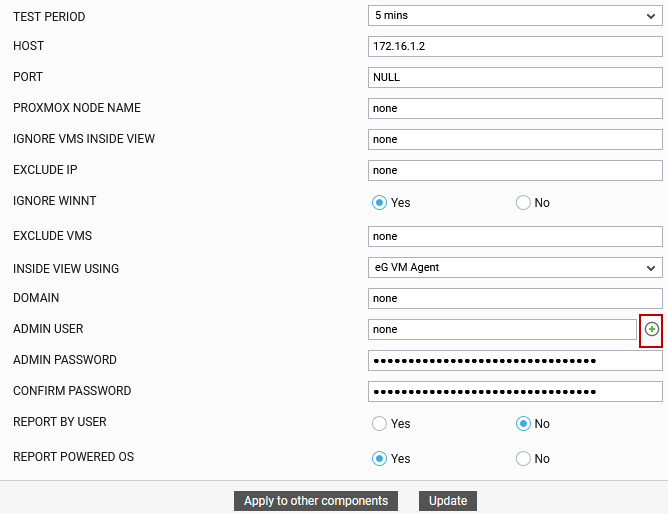
Figure 1 : Configuring a VM test
Upon clicking, Figure 2 will appear, using which the VM user details can be configured.
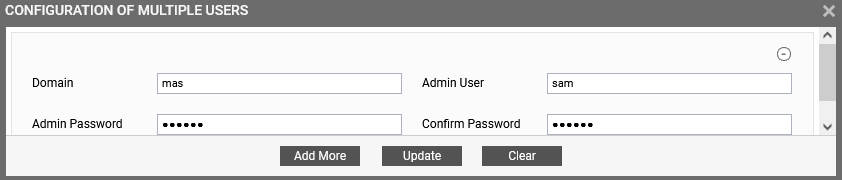
Figure 2 : The VM user configuration page
To add a user specification, do the following:
- First, provide the name of the Domain to which the VMs belong (see Figure 2). If one/more VMs do not belong to any domain, then, specify none here.
- The eG agent must be configured with user privileges that will allow the agent to communicate with the VMs in a particular domain and extract statistics. If none is specified against Domain, then a local user account can be provided against Admin User. On the other hand, if a valid Domain name has been specified, then a domain administrator account can be provided in the Admin User text box. If key-based authentication is implemented between the eG agent and the SSH daemon of a Linux guest, then, in the Admin User text box, enter the name of the user whose <user_home_dir> (on that Linux guest) contains a .ssh directory with the public key file named authorized_keys. The admin password in this case will be the passphrase of the public key; the default public key file that is bundled with the eG agent takes the password eginnovations. Specify this as the admin password if you are using the default private/public key pair that is bundled with the eG agent to implement key-based authentication. On the other hand, if you are generating a new public/private key pair for this purpose, then use the passphrase that you provide while generating the pair. For the detailed procedure on Implementing Key-based Authentication refer to Troubleshooting the Failure of the eG Remote Agent to Connect to or Report Measures for Linux Guests.
- The password of the specified Admin User should be mentioned in the Admin Password text box.
- Confirm the password by retyping it in the Confirm Password text box.
-
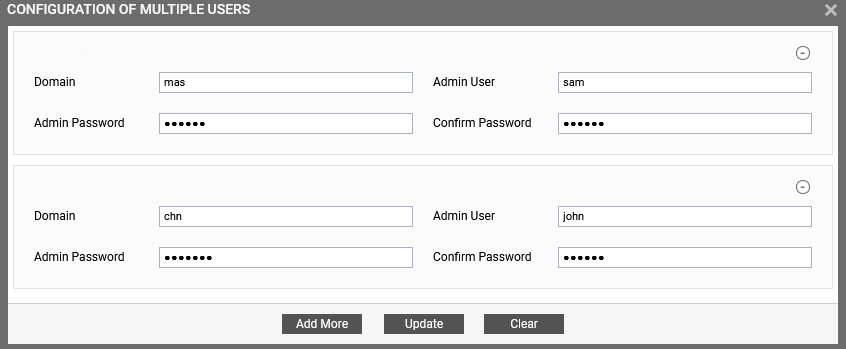
To add more users, click on the Add More button in Figure 2. This will allow you to add one more user specification as depicted by Figure 3.
-
In some virtualized environments, the same Domain could be accessed using multiple Admin User names. For instance, to login to a Domain named chn, the eG agent can use the Admin User name john or the Admin User name matt. You can configure the eG agent with the credentials of both these users as shown by Figure 4.
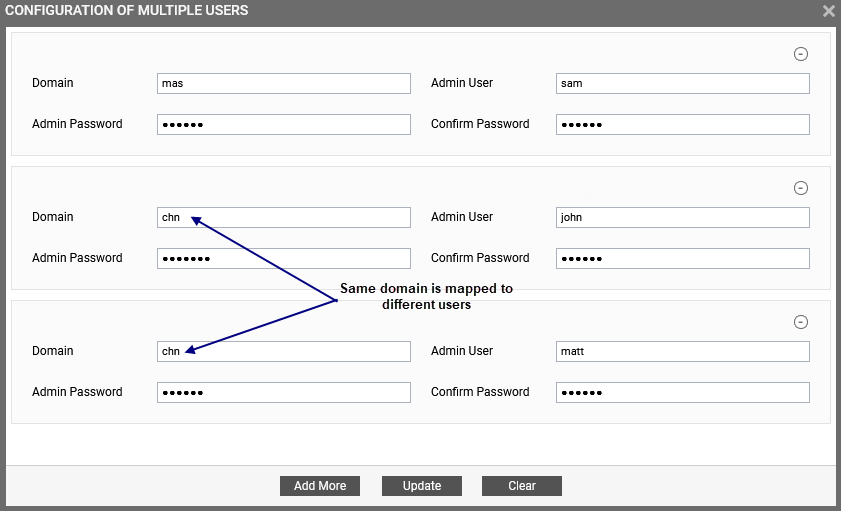
Figure 4 : Associating a single domain with different admin users
When this is done, then, while attempting to connect to the domain, the eG agent will begin by using the first Admin User name of the specification. In the case of Figure 4, this will be john. If, for some reason, the agent is unable to login using the first Admin User name, then it will try to login again, but this time using the second Admin User name of the specification - i.e., matt in our example (see Figure 4). If the first login attempt itself is successful, then the agent will ignore the second Admin User name.
- To clear all the user specifications, simply click the Clear button in Figure 4.
- To remove the details of a particular user alone, just click the
 button in Figure 4.
 -
To save the specification, just click on the Update button in Figure 4. This will lead you back to the test configuration page, where you will find the multiple domain names, user names, and passwords listed against the respective fields (see Figure 4).
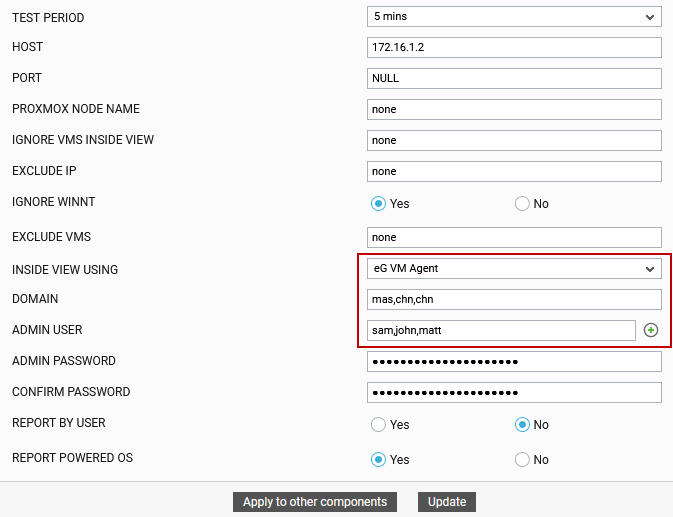
Figure 5 : The test configuration page displaying multiple domain names, user names, and passwords