Monitoring the Proxmox Hypervisor
eG Enterprise provides a specialized model for monitoring Proxmox Hypervisors with VMs that host server applications.
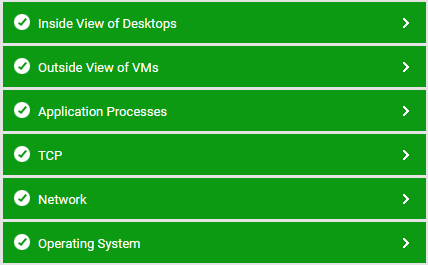
Figure 1 : Layer model of the Proxmox Hypervisor
Each layer of this model is mapped to tests that report on the resource usage of the hypervisor and the VMs inside-out, and point you to resource-hungry VMs and nodes. Using the metrics reported by this model, administrators can find quick and accurate answers to the following performance queries:
- Is any node on the target Proxmox Hypervisor offline?
- Is any node consuming excessive CPU and memory resources?
- Which storage is over-utilized by the target hypervisor?
- Is any storage inactive on the target hypervisor?
- How many VMs are currently active on the target hypervisor?
- Which VMs are currently paused or not running?
- How many VMs have been newly added and which ones were recently removed from the server?
- Is any VM consuming the physical CPU, memory, network, and I/O resources of the Proxmox Hypervisor, abnormally?
- Which VM is utilizing the CPU, memory, network, and I/O resources allocated to it, excessively? Which process on the VM is causing this abnormal resource consumption?
The Application Processes, TCP and Network layers and the tests associated with them have already been discussed in the Monitoring Unix and Windows Servers document.