QVD Hosts Test
If users complain that their desktop is inaccessible or that it takes too long to connect to their desktop, the powered-on state of the virtual desktop or the network connection to the virtual desktop may not always be the cause of the inaccessibility! Problems with the Server Node – such as the Server Node being stopped, the blocking of the Server Node, the inability of the client to connect to the Server Node, login authentication failures, or a Node overload – can also contribute to such accessibility issues. By keeping an eye on the status and operations of the Server Node, administrators can accurately figure out where the performance of the Server Node is bottlenecked, and quickly initiate measures to clear it, so as to augment the user experience with the QVD service. This is where the QVD Hosts test helps! This test continuously tracks the status of, client connections to, the HTTP load on, and the operations of the target Server Node, and proactively alerts administrators to real/potential abnormalities in the overall health, operational efficiency, and processing ability of that Server Node.
Target of the test : A Quality Virtual Desktop Node
Agent deploying the test : A remote agent
Outputs of the test : One set of results for the target Server Node being monitored.
| Parameter | Description |
|---|---|
|
Test period |
How often should the test be executed. |
|
Host |
The host for which the test is to be configured. |
|
QVD User and QVD Password |
Provide the credentials of a user possessing root user privileges in the QVD User and QVD Password text boxes. |
|
Confirm Password |
Confirm the password by retyping it here. |
|
Detailed Diagnosis |
To make diagnosis more efficient and accurate, the eG Enterprise embeds an optional detailed diagnostic capability. With this capability, the eG agents can be configured to run detailed, more elaborate tests as and when specific problems are detected. To enable the detailed diagnosis capability of this test for a particular server, choose the On option. To disable the capability, click on the Off option. The option to selectively enable/disable the detailed diagnosis capability will be available only if the following conditions are fulfilled:
|
| Measurement | Description | Measurement Unit | Interpretation | ||||||||||||
|---|---|---|---|---|---|---|---|---|---|---|---|---|---|---|---|
|
Node state |
Indicates the current state of this Server Node. |
|
The table below displays the States that can be reported by this measure, and their numeric equivalents:
Note: By default, this measure reports one of the States listed in the table above. The graph of this measure however will represent the current state of the Server Node using the numeric equivalents - ‘0’ to ‘4’. The detailed diagnosis of this measure if enabled, lists the details of each Server Node such as the Time, the ID of the node, IP address of the node and the House Keeping Deamon (HKD) of the node. |
||||||||||||
|
Is host blocked? |
Indicates whether/not this Server Node is blocked. |
|
Administrators can Block access to a Server Node. This will disable the Server Node from any behavior within the QVD infrastructure. This is effectively the same as shutting down the Server Node, in the sense that to the rest of the environment the Server Node will be unavailable. If the Server Node is currently hosting any number of virtual machines, and a client attempts to connect the client will not be able to access that Virtual Machine and will receive an error notifying it that the server is currently under maintenance. Clients that are already connected to virtual machines running on a Node that has been blocked will remain connected until they are either forced to disconnect by an Administrator or they disconnect of their own accord. This measure reports a value Yes if the host is blocked and a value No if otherwise. The numeric values that correspond to the measure values discussed above are listed in the table below:
Note: By default, this measure reports the values Yes or No only to indicate whether the node is blocked or not. In the graph of this measure however, the same is represented using the numeric equivalents - 0 or 1. |
||||||||||||
|
Desktops assigned to node |
Indicates the number of virtual desktops that were assigned to this Server Node. |
Number |
The detailed diagnosis of this measure if enabled, lists the Desktop ID, Name of the Desktop, the user who has been assigned the desktop, IP address of the desktop, the OSF of the desktop, the Disk Image tag of the desktop, the Disk Image of the desktop, the current status of the desktop and whether/not the Server Node is in the Blocked state currently. |
||||||||||||
|
HTTP requests |
Indicates the number of HTTP requests handled by this Server Node. |
Number |
This is a good indicator of the workload on the Server Node. A consistent increase in this value over time signals a potential overload condition. |
||||||||||||
|
Authentication attempts |
Indicates the number of authentication attempts made by this Server Node. |
Number |
The L7R component within the Server Node connects to the backend PostgreSQL database to determine how authentication should take place (i.e. locally or using an external LDAP directory) and take the appropriate steps to perform the authentication process. The L7R will return an HTTP OK response if the authentication was successful, or will return a 401 Unauthorized if authentication fails. If authentication fails, users will not be able to gain access to their virtual desktops. Frequent failures therefore can adversely impact user experience with the desktop delivery service. This is why, the Percentage of successful authentications should be high and the number of Failed authentications should be low. Authentication failures can occur owing to improper configuration of the authentication process, invalid login credentials provided by user at login, and even due to the unavailability/inaccessibility of the PostgreSQL server that stores the configuration. |
||||||||||||
|
Successful authentications |
Indicates the number of authentication attempts made by this host that were successful. |
Number |
|||||||||||||
|
Percentage of successful authentications |
Indicates the percentage of authentication attempts that were successful. |
Percent |
|||||||||||||
|
Failed authentications |
Indicates the number of authentication attempts that failed. |
Number |
|||||||||||||
|
NX protocol attempts |
Indicates the number of NX protocol attempts made by this Server Node. |
Number |
The NX protocol is used to handle remote X Windows connections and provides superior compression to allow for high performance even when accessing the desktop over a low-bandwidth connection. Furthermore, the QVD is able to encapsulate the NX protocol with SSL to secure connectivity so that users can work in a safe and secure manner, even if accessing their desktops from remote locations. Failure of NX connections between the client and Server Node causes users to be denied access to their virtual desktops. A high value for the Failed NX protocol attempts measure and a low value for the Percentage of successful attempts measure is hence a cause for concern. |
||||||||||||
|
Successful NX protocol attempts |
Indicates the number of NX protocol attempts that were successful. |
Number |
|||||||||||||
|
Percentage of successful attempts |
Indicates the percentage of successful NX protocol attempts made by this host. |
Percent |
|||||||||||||
|
Failed NX protocol attempts |
Indicates the number of NX protocol attempts that failed for this host. |
Number |
|||||||||||||
|
Short sessions |
Indicates the number of sessions that were of short duration on this host. |
Number |
A high value of this measure could indicate that too many sessions logged out as soon as they logged into the Server Node. This could be owing to a low timeout setting on the node. |
The detailed diagnosis of the Node state measure (see Figure 1) lists the details of each Server Node such as the Time, the ID of the node, IP address of the node and the House Keeping Deamon (HKD) of the host.
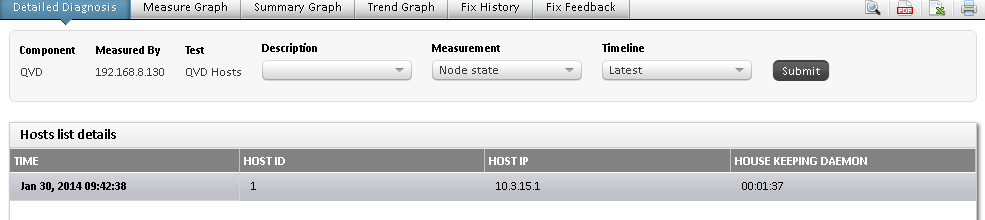
Figure 1 : The detailed diagnosis of the Node state measure
The detailed diagnosis of the Desktops assigned to node measure lists the Desktop ID, Name of the Desktop, the user who has been assigned the desktop, IP address of the desktop, the OSF of the desktop, the Disk Image tag of the desktop, the Disk Image of the desktop, the current status of the desktop and an indicator as to whether the node is blocked or not.
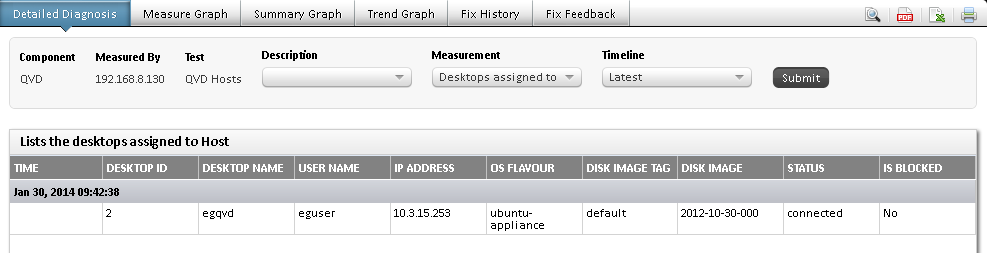
Figure 2 : The detailed diagnosis of the Desktops assigned to node measure