Monitoring the RabbitMQ Cluster
Now that the RabbitMQ cluster is monitoring-ready, proceed to view the performance results reported by the eG agent for the RabbitMQ cluster. For that, login to the eG user interface as any user with monitoring rights to the cluster.
eG Enterprise provides a specialized monitoring model for the RabbitMQ cluster.

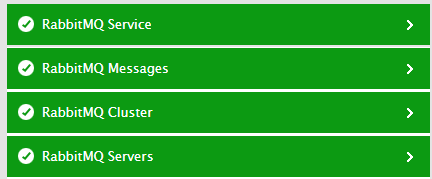
Figure 3 : Layer model of the RabbitMQ Cluster
Each layer of Figure 3 is mapped to tests that report on the health of the cluster, the servers in the cluster, and the message queues, channels, and client connections to the cluster. Using the metrics reported by these tests, administrators can find quick and accurate answers to certain persistent performance queries, such as the following:
- Are any nodes in the cluster not running presently? If so, which nodes are these?
- Is any node in the cluster consuming file and/or socket descriptors abnormally? Which node is this?
- Is any node consuming memory excessively? Which node is this?
- Are Erlang processes been over-utilized by any node? Which node is this?
- Is any node's bandwidth usage unusually high?
- Are disk IOPS abnormally high on any node?
- Has garbage collection occurred very frequently on any node? Which node is it? How much heap memory was reclaimed during the garbage collection on that node?
- What is the current message load on the cluster?
- Which type of messages are being delivered slowly - messages to consumers requiring acknowledgement? or messages to consumers not requiring acknowledgement?
- Are too many messages delivered to consumers using manual acknowledgement? If so, which queue delivered such messages the most?
- Are any messages being redelivered?
- Have any messages been returned?
- Are too many messages read from and written to disks every second? If so, which queue is generating this high level of disk activity?
- Is any queue abnormally long in terms of number of messages it contains?
- Are there any idle queues?
- Is any queue consuming memory excessively? What could be causing the memory drain - a large number of unacknowledged messages in the queue?
- How are the virtual hosts the configured user has access to, performing? Is any virtual host handling too many unacknowledged messages? Which virtual host is seeing an unusual number of redelivered and returned messages?
- Over which application and client connection is the too much data transmitted?
- What type of exchanges are operational? Is any exchange processing messages published to it slowly?
- What is the overall connection and channel load on the cluster? Which connection/channel is imposing the maximum load in terms of the number of reductions invoked?
- Are consumers of any channel prefetching messages at an abnormal rate? Could this be owing to an improper Prefetch count setting?
Use the following links to deep-dive into each layer and the metrics they report.