Monitoring the Radware Alteon Load Balancer
To monitor the managed Alteon load balancer, login to the eG management console as a user with monitoring privileges.
Browse the Components At-A-Glance section of the Monitor Home page that appears, and locate the Radware Alteon Load Balancer component type. Click on the bar that corresponds to this component type. This will lead you to the Layers tab page, where you can view the monitoring model for the load balancer (see Figure 3).
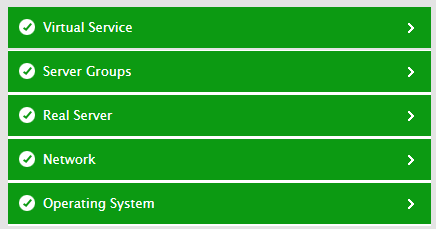
Figure 3 : Layer model of the Radware Alteon Load Balancer
Each layer of Figure 3 is mapped to tests that report on the health of a particular KPI of the load balancer. Using the metrics reported, administrators can find quick and accurate answers to many persistent performance queries related to the composer:
- Is the load balancer available over the network? If so, is network connection to the load balancer latent?
- Is the load balancer experiencing any network traffic congestion?
- What is the typical session load on the load balancer?
- Has the load balancer's fan been unplugged?
- Has the fan failed to operate despite being plugged?
- Is the power supply unit in an abnormal state currently? Has only a single power supply unit failed, or have both units failed?
- Has the load balancer's temperature surged beyond its threshold?
- Is management traffic hogging CPU resources of the management processor?
- Is the management processor using memory excessively?
- Is any Switch Processor hogging CPU and/or memory resources?
- Is the consumption of throughput capacity, compression capacity, and SSL connections within licensed limits?
- Which service group is this load balancing device a master node for? Which service group is it a backup node for?
- Which real server group is seeing the maximum user traffic?
- Are any real servers down presently? If so, which real server group do they belong to and which virtual server is mapped to that group?
- Has any real server failed? If so, which one?
- How is load distributed across real servers in a group? Is any server overloaded with sessions? Is any server handling more data than the rest?
- Which virtual server is seeing maximum user traffic currently? Which server groups and real servers are mapped to this virtual server?