Monitoring Riverbed SteelHead
eG Enterprise offers a dedicated monitoring model for Riverbed SteelHead which periodically monitors the system status, connection status, application traffic, CPU usage, Data Store and uptime of the appliance.
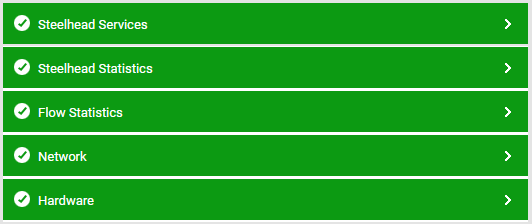
Figure 1 : Riverbed SteelHead Layer
Using the metrics reported by the tests mapped to this layer, administrators can find quick and accurate answers to certain persistent performance queries, such as the following:
- Is Riverbed SteelHead appliance available?
-
How long the appliance has been up since the last reboot?
-
How well the CPU is utilized by the SteelHead appliance?
- Is the Data Store running without space?
-
How much network traffic has been generated by the Source and Destination IPs? Which IP address is responsible for generating the maximum load?
- How much network traffic has generated by the application? Which application port is consuming maximum bandwidth?
- What is the current status of the processes running on the Riverbed SteelHead appliance?